Chinese vs Immigrants from Brazil In Labor Force | Age 20-64
COMPARE
Chinese
Immigrants from Brazil
In Labor Force | Age 20-64
In Labor Force | Age 20-64 Comparison
Chinese
Immigrants from Brazil
80.7%
IN LABOR FORCE | AGE 20-64
99.9/ 100
METRIC RATING
33rd/ 347
METRIC RANK
80.7%
IN LABOR FORCE | AGE 20-64
99.9/ 100
METRIC RATING
34th/ 347
METRIC RANK
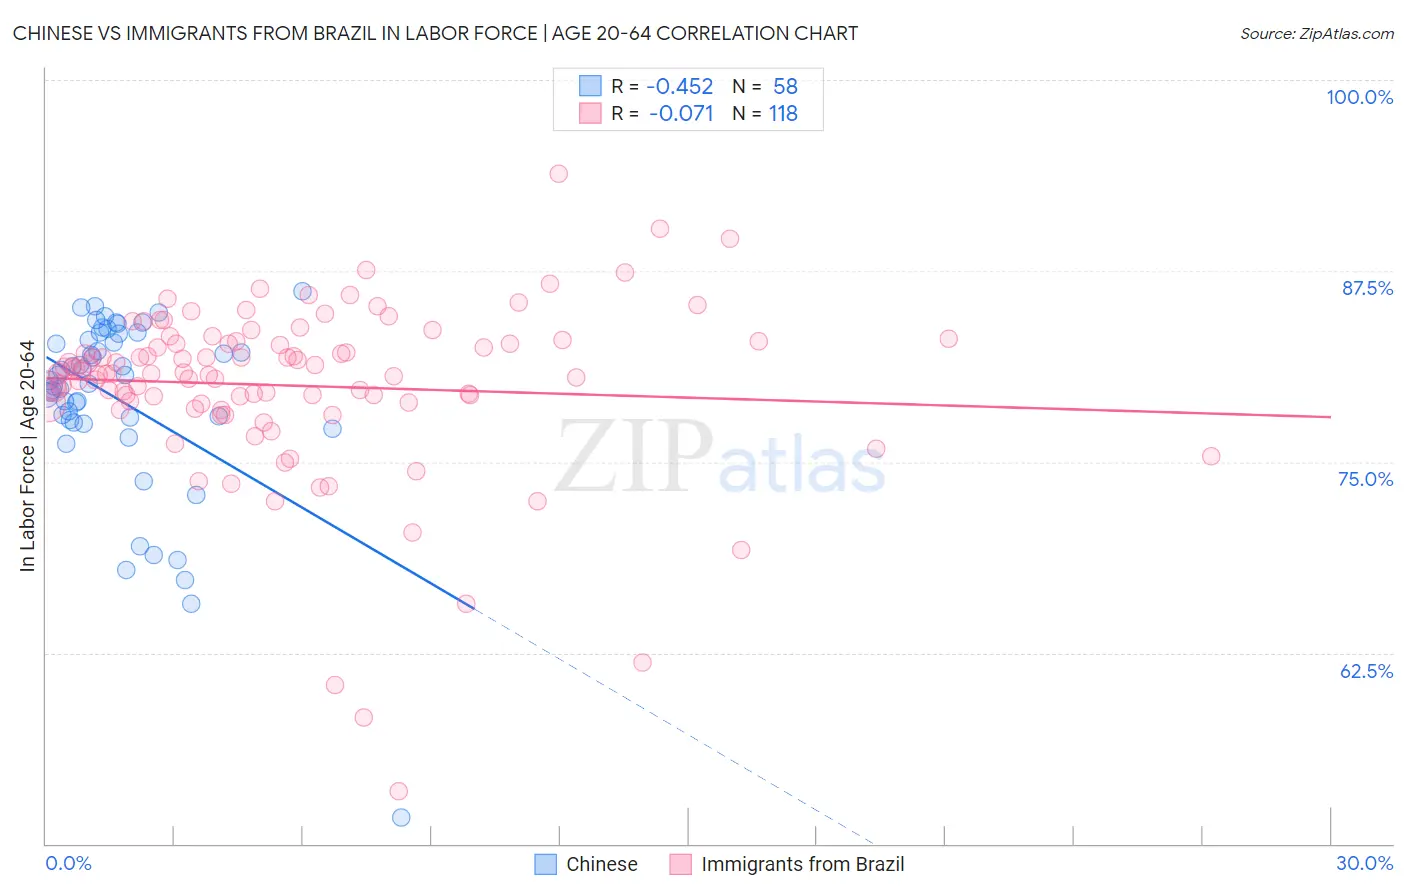
Chinese vs Immigrants from Brazil In Labor Force | Age 20-64 Correlation Chart
The statistical analysis conducted on geographies consisting of 64,809,125 people shows a moderate negative correlation between the proportion of Chinese and labor force participation rate among population between the ages 20 and 64 in the United States with a correlation coefficient (R) of -0.452 and weighted average of 80.7%. Similarly, the statistical analysis conducted on geographies consisting of 343,008,665 people shows a slight negative correlation between the proportion of Immigrants from Brazil and labor force participation rate among population between the ages 20 and 64 in the United States with a correlation coefficient (R) of -0.071 and weighted average of 80.7%, a difference of 0.020%.
In Labor Force | Age 20-64 Correlation Summary
| Measurement | Chinese | Immigrants from Brazil |
| Minimum | 51.7% | 53.4% |
| Maximum | 86.2% | 93.9% |
| Range | 34.5% | 40.5% |
| Mean | 79.0% | 80.0% |
| Median | 80.5% | 80.8% |
| Interquartile 25% (IQ1) | 77.7% | 78.8% |
| Interquartile 75% (IQ3) | 83.0% | 82.9% |
| Interquartile Range (IQR) | 5.3% | 4.1% |
| Standard Deviation (Sample) | 6.1% | 5.8% |
| Standard Deviation (Population) | 6.0% | 5.8% |
Demographics Similar to Chinese and Immigrants from Brazil by In Labor Force | Age 20-64
In terms of in labor force | age 20-64, the demographic groups most similar to Chinese are Immigrants from Ireland (80.7%, a difference of 0.030%), Immigrants from Lithuania (80.7%, a difference of 0.040%), Immigrants from Poland (80.6%, a difference of 0.050%), Immigrants from North Macedonia (80.7%, a difference of 0.060%), and Immigrants from South Central Asia (80.7%, a difference of 0.070%). Similarly, the demographic groups most similar to Immigrants from Brazil are Immigrants from Poland (80.6%, a difference of 0.030%), Immigrants from Ireland (80.7%, a difference of 0.060%), Immigrants from Lithuania (80.7%, a difference of 0.070%), Immigrants from South Central Asia (80.7%, a difference of 0.090%), and Immigrants from North Macedonia (80.7%, a difference of 0.090%).
| Demographics | Rating | Rank | In Labor Force | Age 20-64 |
| Immigrants | Bosnia and Herzegovina | 100.0 /100 | #23 | Exceptional 80.8% |
| Immigrants | Morocco | 100.0 /100 | #24 | Exceptional 80.8% |
| Kenyans | 100.0 /100 | #25 | Exceptional 80.8% |
| Immigrants | Serbia | 100.0 /100 | #26 | Exceptional 80.8% |
| Immigrants | Kenya | 99.9 /100 | #27 | Exceptional 80.7% |
| Immigrants | Uganda | 99.9 /100 | #28 | Exceptional 80.7% |
| Immigrants | South Central Asia | 99.9 /100 | #29 | Exceptional 80.7% |
| Immigrants | North Macedonia | 99.9 /100 | #30 | Exceptional 80.7% |
| Immigrants | Lithuania | 99.9 /100 | #31 | Exceptional 80.7% |
| Immigrants | Ireland | 99.9 /100 | #32 | Exceptional 80.7% |
| Chinese | 99.9 /100 | #33 | Exceptional 80.7% |
| Immigrants | Brazil | 99.9 /100 | #34 | Exceptional 80.7% |
| Immigrants | Poland | 99.9 /100 | #35 | Exceptional 80.6% |
| Paraguayans | 99.8 /100 | #36 | Exceptional 80.6% |
| Immigrants | Moldova | 99.8 /100 | #37 | Exceptional 80.6% |
| Ugandans | 99.8 /100 | #38 | Exceptional 80.6% |
| Brazilians | 99.8 /100 | #39 | Exceptional 80.5% |
| Immigrants | Zimbabwe | 99.8 /100 | #40 | Exceptional 80.5% |
| Immigrants | Liberia | 99.8 /100 | #41 | Exceptional 80.5% |
| Latvians | 99.8 /100 | #42 | Exceptional 80.5% |
| Czechs | 99.7 /100 | #43 | Exceptional 80.5% |