Chinese vs Immigrants from Taiwan In Labor Force | Age 20-64
COMPARE
Chinese
Immigrants from Taiwan
In Labor Force | Age 20-64
In Labor Force | Age 20-64 Comparison
Chinese
Immigrants from Taiwan
80.7%
IN LABOR FORCE | AGE 20-64
99.9/ 100
METRIC RATING
33rd/ 347
METRIC RANK
80.0%
IN LABOR FORCE | AGE 20-64
92.5/ 100
METRIC RATING
119th/ 347
METRIC RANK
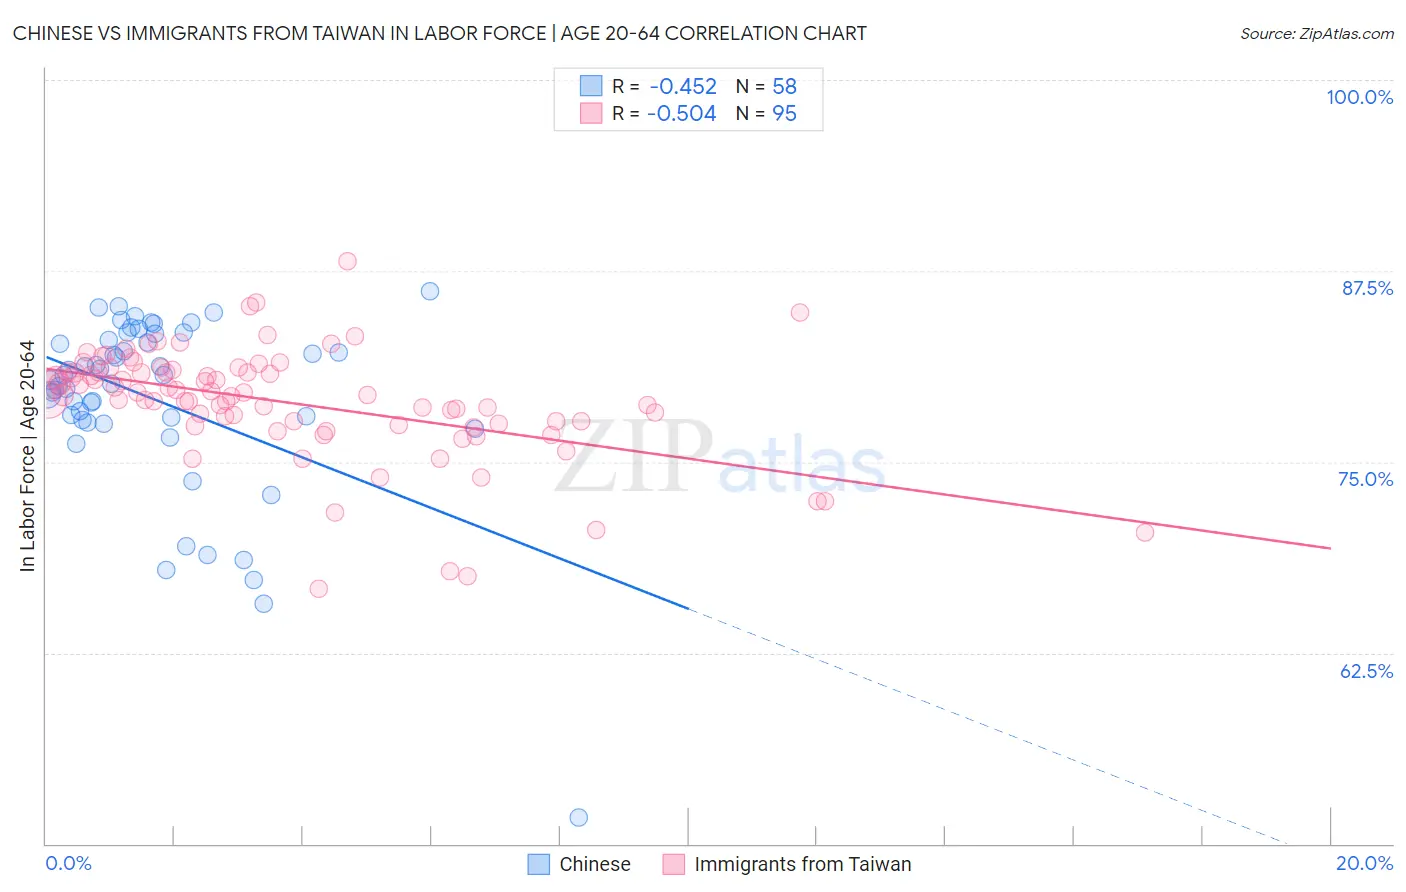
Chinese vs Immigrants from Taiwan In Labor Force | Age 20-64 Correlation Chart
The statistical analysis conducted on geographies consisting of 64,809,125 people shows a moderate negative correlation between the proportion of Chinese and labor force participation rate among population between the ages 20 and 64 in the United States with a correlation coefficient (R) of -0.452 and weighted average of 80.7%. Similarly, the statistical analysis conducted on geographies consisting of 298,293,135 people shows a substantial negative correlation between the proportion of Immigrants from Taiwan and labor force participation rate among population between the ages 20 and 64 in the United States with a correlation coefficient (R) of -0.504 and weighted average of 80.0%, a difference of 0.89%.
In Labor Force | Age 20-64 Correlation Summary
| Measurement | Chinese | Immigrants from Taiwan |
| Minimum | 51.7% | 66.7% |
| Maximum | 86.2% | 88.1% |
| Range | 34.5% | 21.4% |
| Mean | 79.0% | 78.9% |
| Median | 80.5% | 79.4% |
| Interquartile 25% (IQ1) | 77.7% | 77.5% |
| Interquartile 75% (IQ3) | 83.0% | 80.9% |
| Interquartile Range (IQR) | 5.3% | 3.4% |
| Standard Deviation (Sample) | 6.1% | 3.7% |
| Standard Deviation (Population) | 6.0% | 3.7% |
Similar Demographics by In Labor Force | Age 20-64
Demographics Similar to Chinese by In Labor Force | Age 20-64
In terms of in labor force | age 20-64, the demographic groups most similar to Chinese are Immigrants from Brazil (80.7%, a difference of 0.020%), Immigrants from Ireland (80.7%, a difference of 0.030%), Immigrants from Lithuania (80.7%, a difference of 0.040%), Immigrants from Poland (80.6%, a difference of 0.050%), and Immigrants from North Macedonia (80.7%, a difference of 0.060%).
| Demographics | Rating | Rank | In Labor Force | Age 20-64 |
| Immigrants | Serbia | 100.0 /100 | #26 | Exceptional 80.8% |
| Immigrants | Kenya | 99.9 /100 | #27 | Exceptional 80.7% |
| Immigrants | Uganda | 99.9 /100 | #28 | Exceptional 80.7% |
| Immigrants | South Central Asia | 99.9 /100 | #29 | Exceptional 80.7% |
| Immigrants | North Macedonia | 99.9 /100 | #30 | Exceptional 80.7% |
| Immigrants | Lithuania | 99.9 /100 | #31 | Exceptional 80.7% |
| Immigrants | Ireland | 99.9 /100 | #32 | Exceptional 80.7% |
| Chinese | 99.9 /100 | #33 | Exceptional 80.7% |
| Immigrants | Brazil | 99.9 /100 | #34 | Exceptional 80.7% |
| Immigrants | Poland | 99.9 /100 | #35 | Exceptional 80.6% |
| Paraguayans | 99.8 /100 | #36 | Exceptional 80.6% |
| Immigrants | Moldova | 99.8 /100 | #37 | Exceptional 80.6% |
| Ugandans | 99.8 /100 | #38 | Exceptional 80.6% |
| Brazilians | 99.8 /100 | #39 | Exceptional 80.5% |
| Immigrants | Zimbabwe | 99.8 /100 | #40 | Exceptional 80.5% |
Demographics Similar to Immigrants from Taiwan by In Labor Force | Age 20-64
In terms of in labor force | age 20-64, the demographic groups most similar to Immigrants from Taiwan are Maltese (80.0%, a difference of 0.0%), Immigrants from Vietnam (80.0%, a difference of 0.010%), Cape Verdean (80.0%, a difference of 0.010%), Immigrants from Kuwait (80.0%, a difference of 0.010%), and Mongolian (79.9%, a difference of 0.010%).
| Demographics | Rating | Rank | In Labor Force | Age 20-64 |
| Immigrants | Italy | 93.9 /100 | #112 | Exceptional 80.0% |
| Sri Lankans | 93.9 /100 | #113 | Exceptional 80.0% |
| Argentineans | 93.8 /100 | #114 | Exceptional 80.0% |
| Bermudans | 93.3 /100 | #115 | Exceptional 80.0% |
| Immigrants | Western Africa | 93.1 /100 | #116 | Exceptional 80.0% |
| Immigrants | Vietnam | 92.7 /100 | #117 | Exceptional 80.0% |
| Cape Verdeans | 92.7 /100 | #118 | Exceptional 80.0% |
| Immigrants | Taiwan | 92.5 /100 | #119 | Exceptional 80.0% |
| Maltese | 92.4 /100 | #120 | Exceptional 80.0% |
| Immigrants | Kuwait | 92.2 /100 | #121 | Exceptional 80.0% |
| Mongolians | 92.0 /100 | #122 | Exceptional 79.9% |
| Immigrants | Russia | 91.8 /100 | #123 | Exceptional 79.9% |
| Immigrants | Europe | 91.6 /100 | #124 | Exceptional 79.9% |
| Danes | 91.5 /100 | #125 | Exceptional 79.9% |
| Immigrants | France | 90.7 /100 | #126 | Exceptional 79.9% |