British West Indian vs Norwegian In Labor Force | Age 20-64
COMPARE
British West Indian
Norwegian
In Labor Force | Age 20-64
In Labor Force | Age 20-64 Comparison
British West Indians
Norwegians
78.4%
IN LABOR FORCE | AGE 20-64
0.1/ 100
METRIC RATING
265th/ 347
METRIC RANK
81.0%
IN LABOR FORCE | AGE 20-64
100.0/ 100
METRIC RATING
17th/ 347
METRIC RANK
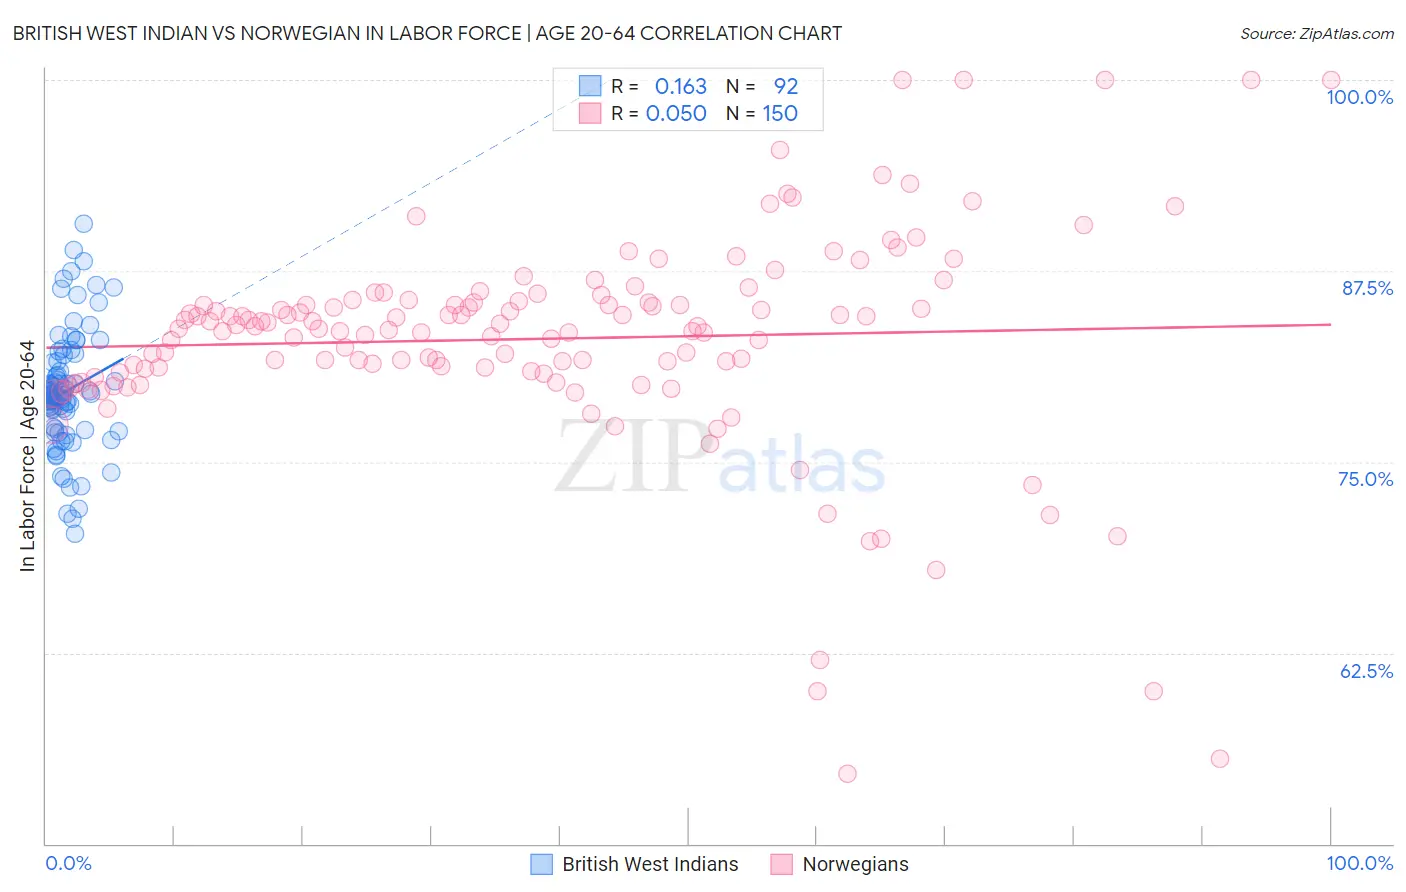
British West Indian vs Norwegian In Labor Force | Age 20-64 Correlation Chart
The statistical analysis conducted on geographies consisting of 152,617,449 people shows a poor positive correlation between the proportion of British West Indians and labor force participation rate among population between the ages 20 and 64 in the United States with a correlation coefficient (R) of 0.163 and weighted average of 78.4%. Similarly, the statistical analysis conducted on geographies consisting of 533,390,908 people shows no correlation between the proportion of Norwegians and labor force participation rate among population between the ages 20 and 64 in the United States with a correlation coefficient (R) of 0.050 and weighted average of 81.0%, a difference of 3.3%.
In Labor Force | Age 20-64 Correlation Summary
| Measurement | British West Indian | Norwegian |
| Minimum | 70.3% | 54.6% |
| Maximum | 90.6% | 100.0% |
| Range | 20.3% | 45.4% |
| Mean | 79.6% | 83.1% |
| Median | 79.4% | 83.8% |
| Interquartile 25% (IQ1) | 77.2% | 80.9% |
| Interquartile 75% (IQ3) | 81.5% | 85.6% |
| Interquartile Range (IQR) | 4.3% | 4.6% |
| Standard Deviation (Sample) | 3.9% | 7.1% |
| Standard Deviation (Population) | 3.9% | 7.1% |
Similar Demographics by In Labor Force | Age 20-64
Demographics Similar to British West Indians by In Labor Force | Age 20-64
In terms of in labor force | age 20-64, the demographic groups most similar to British West Indians are Bahamian (78.4%, a difference of 0.010%), U.S. Virgin Islander (78.4%, a difference of 0.030%), Spaniard (78.4%, a difference of 0.040%), Pennsylvania German (78.4%, a difference of 0.050%), and West Indian (78.3%, a difference of 0.050%).
| Demographics | Rating | Rank | In Labor Force | Age 20-64 |
| Immigrants | Guatemala | 0.4 /100 | #258 | Tragic 78.7% |
| Tsimshian | 0.4 /100 | #259 | Tragic 78.7% |
| Immigrants | Fiji | 0.3 /100 | #260 | Tragic 78.6% |
| Whites/Caucasians | 0.2 /100 | #261 | Tragic 78.5% |
| Fijians | 0.1 /100 | #262 | Tragic 78.4% |
| Pennsylvania Germans | 0.1 /100 | #263 | Tragic 78.4% |
| Spaniards | 0.1 /100 | #264 | Tragic 78.4% |
| British West Indians | 0.1 /100 | #265 | Tragic 78.4% |
| Bahamians | 0.1 /100 | #266 | Tragic 78.4% |
| U.S. Virgin Islanders | 0.1 /100 | #267 | Tragic 78.4% |
| West Indians | 0.0 /100 | #268 | Tragic 78.3% |
| Immigrants | Barbados | 0.0 /100 | #269 | Tragic 78.3% |
| Scotch-Irish | 0.0 /100 | #270 | Tragic 78.3% |
| Immigrants | Latin America | 0.0 /100 | #271 | Tragic 78.3% |
| Marshallese | 0.0 /100 | #272 | Tragic 78.3% |
Demographics Similar to Norwegians by In Labor Force | Age 20-64
In terms of in labor force | age 20-64, the demographic groups most similar to Norwegians are Immigrants from Bulgaria (81.0%, a difference of 0.010%), Zimbabwean (81.0%, a difference of 0.020%), Thai (80.9%, a difference of 0.070%), Liberian (80.9%, a difference of 0.080%), and Bulgarian (81.1%, a difference of 0.11%).
| Demographics | Rating | Rank | In Labor Force | Age 20-64 |
| Immigrants | Sierra Leone | 100.0 /100 | #10 | Exceptional 81.5% |
| Immigrants | Eastern Africa | 100.0 /100 | #11 | Exceptional 81.3% |
| Immigrants | Eritrea | 100.0 /100 | #12 | Exceptional 81.3% |
| Immigrants | India | 100.0 /100 | #13 | Exceptional 81.3% |
| Cambodians | 100.0 /100 | #14 | Exceptional 81.1% |
| Bulgarians | 100.0 /100 | #15 | Exceptional 81.1% |
| Immigrants | Nepal | 100.0 /100 | #16 | Exceptional 81.1% |
| Norwegians | 100.0 /100 | #17 | Exceptional 81.0% |
| Immigrants | Bulgaria | 100.0 /100 | #18 | Exceptional 81.0% |
| Zimbabweans | 100.0 /100 | #19 | Exceptional 81.0% |
| Thais | 100.0 /100 | #20 | Exceptional 80.9% |
| Liberians | 100.0 /100 | #21 | Exceptional 80.9% |
| Sudanese | 100.0 /100 | #22 | Exceptional 80.8% |
| Immigrants | Bosnia and Herzegovina | 100.0 /100 | #23 | Exceptional 80.8% |
| Immigrants | Morocco | 100.0 /100 | #24 | Exceptional 80.8% |