Chickasaw vs Zimbabwean In Labor Force | Age 45-54
COMPARE
Chickasaw
Zimbabwean
In Labor Force | Age 45-54
In Labor Force | Age 45-54 Comparison
Chickasaw
Zimbabweans
79.0%
IN LABOR FORCE | AGE 45-54
0.0/ 100
METRIC RATING
318th/ 347
METRIC RANK
84.0%
IN LABOR FORCE | AGE 45-54
99.9/ 100
METRIC RATING
17th/ 347
METRIC RANK
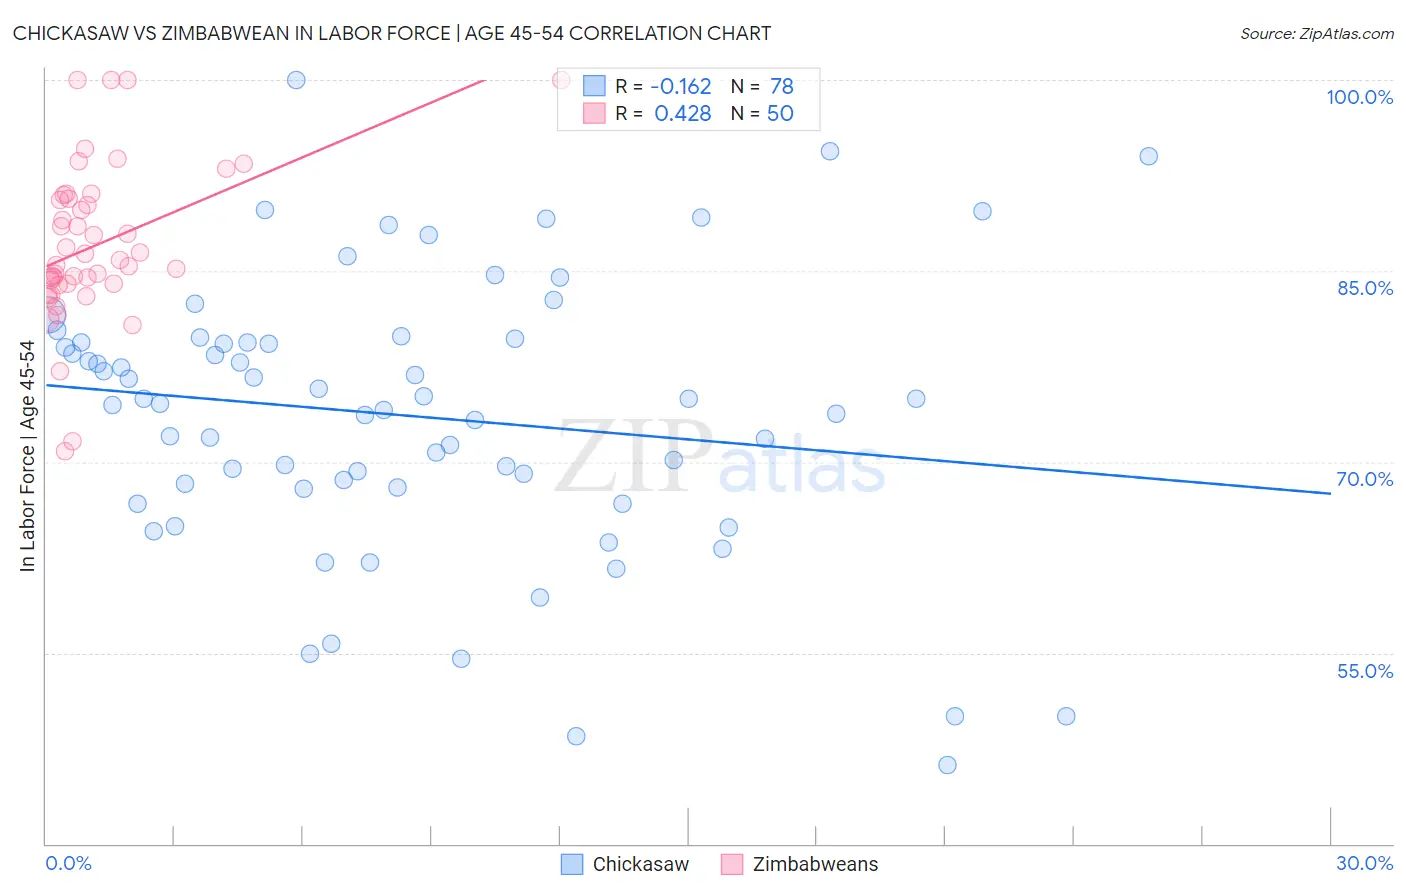
Chickasaw vs Zimbabwean In Labor Force | Age 45-54 Correlation Chart
The statistical analysis conducted on geographies consisting of 147,675,622 people shows a poor negative correlation between the proportion of Chickasaw and labor force participation rate among population between the ages 45 and 54 in the United States with a correlation coefficient (R) of -0.162 and weighted average of 79.0%. Similarly, the statistical analysis conducted on geographies consisting of 69,187,806 people shows a moderate positive correlation between the proportion of Zimbabweans and labor force participation rate among population between the ages 45 and 54 in the United States with a correlation coefficient (R) of 0.428 and weighted average of 84.0%, a difference of 6.3%.
In Labor Force | Age 45-54 Correlation Summary
| Measurement | Chickasaw | Zimbabwean |
| Minimum | 46.2% | 70.8% |
| Maximum | 100.0% | 100.0% |
| Range | 53.8% | 29.2% |
| Mean | 73.6% | 87.0% |
| Median | 74.8% | 85.7% |
| Interquartile 25% (IQ1) | 68.0% | 84.0% |
| Interquartile 75% (IQ3) | 79.4% | 90.6% |
| Interquartile Range (IQR) | 11.4% | 6.6% |
| Standard Deviation (Sample) | 10.8% | 6.2% |
| Standard Deviation (Population) | 10.7% | 6.1% |
Similar Demographics by In Labor Force | Age 45-54
Demographics Similar to Chickasaw by In Labor Force | Age 45-54
In terms of in labor force | age 45-54, the demographic groups most similar to Chickasaw are Cherokee (79.0%, a difference of 0.10%), Comanche (79.2%, a difference of 0.17%), Yaqui (78.9%, a difference of 0.21%), Shoshone (79.3%, a difference of 0.31%), and Black/African American (79.3%, a difference of 0.39%).
| Demographics | Rating | Rank | In Labor Force | Age 45-54 |
| Mexicans | 0.0 /100 | #311 | Tragic 79.8% |
| Immigrants | Mexico | 0.0 /100 | #312 | Tragic 79.7% |
| Colville | 0.0 /100 | #313 | Tragic 79.5% |
| Ottawa | 0.0 /100 | #314 | Tragic 79.5% |
| Blacks/African Americans | 0.0 /100 | #315 | Tragic 79.3% |
| Shoshone | 0.0 /100 | #316 | Tragic 79.3% |
| Comanche | 0.0 /100 | #317 | Tragic 79.2% |
| Chickasaw | 0.0 /100 | #318 | Tragic 79.0% |
| Cherokee | 0.0 /100 | #319 | Tragic 79.0% |
| Yaqui | 0.0 /100 | #320 | Tragic 78.9% |
| Yup'ik | 0.0 /100 | #321 | Tragic 78.6% |
| Crow | 0.0 /100 | #322 | Tragic 78.3% |
| Kiowa | 0.0 /100 | #323 | Tragic 78.3% |
| Dutch West Indians | 0.0 /100 | #324 | Tragic 78.2% |
| Choctaw | 0.0 /100 | #325 | Tragic 78.2% |
Demographics Similar to Zimbabweans by In Labor Force | Age 45-54
In terms of in labor force | age 45-54, the demographic groups most similar to Zimbabweans are Immigrants from South Central Asia (84.0%, a difference of 0.0%), Immigrants from Nepal (84.0%, a difference of 0.020%), Cypriot (84.1%, a difference of 0.040%), Cambodian (84.1%, a difference of 0.10%), and Czech (83.9%, a difference of 0.11%).
| Demographics | Rating | Rank | In Labor Force | Age 45-54 |
| Norwegians | 100.0 /100 | #10 | Exceptional 84.4% |
| Thais | 100.0 /100 | #11 | Exceptional 84.3% |
| Bulgarians | 100.0 /100 | #12 | Exceptional 84.2% |
| Chinese | 99.9 /100 | #13 | Exceptional 84.1% |
| Cambodians | 99.9 /100 | #14 | Exceptional 84.1% |
| Cypriots | 99.9 /100 | #15 | Exceptional 84.1% |
| Immigrants | Nepal | 99.9 /100 | #16 | Exceptional 84.0% |
| Zimbabweans | 99.9 /100 | #17 | Exceptional 84.0% |
| Immigrants | South Central Asia | 99.9 /100 | #18 | Exceptional 84.0% |
| Czechs | 99.8 /100 | #19 | Exceptional 83.9% |
| Immigrants | Eastern Africa | 99.8 /100 | #20 | Exceptional 83.9% |
| Immigrants | Sri Lanka | 99.8 /100 | #21 | Exceptional 83.9% |
| Immigrants | Ireland | 99.8 /100 | #22 | Exceptional 83.9% |
| Tlingit-Haida | 99.8 /100 | #23 | Exceptional 83.9% |
| Slovenes | 99.8 /100 | #24 | Exceptional 83.9% |