Chickasaw vs Immigrants from Caribbean In Labor Force | Age 45-54
COMPARE
Chickasaw
Immigrants from Caribbean
In Labor Force | Age 45-54
In Labor Force | Age 45-54 Comparison
Chickasaw
Immigrants from Caribbean
79.0%
IN LABOR FORCE | AGE 45-54
0.0/ 100
METRIC RATING
318th/ 347
METRIC RANK
82.1%
IN LABOR FORCE | AGE 45-54
2.5/ 100
METRIC RATING
226th/ 347
METRIC RANK
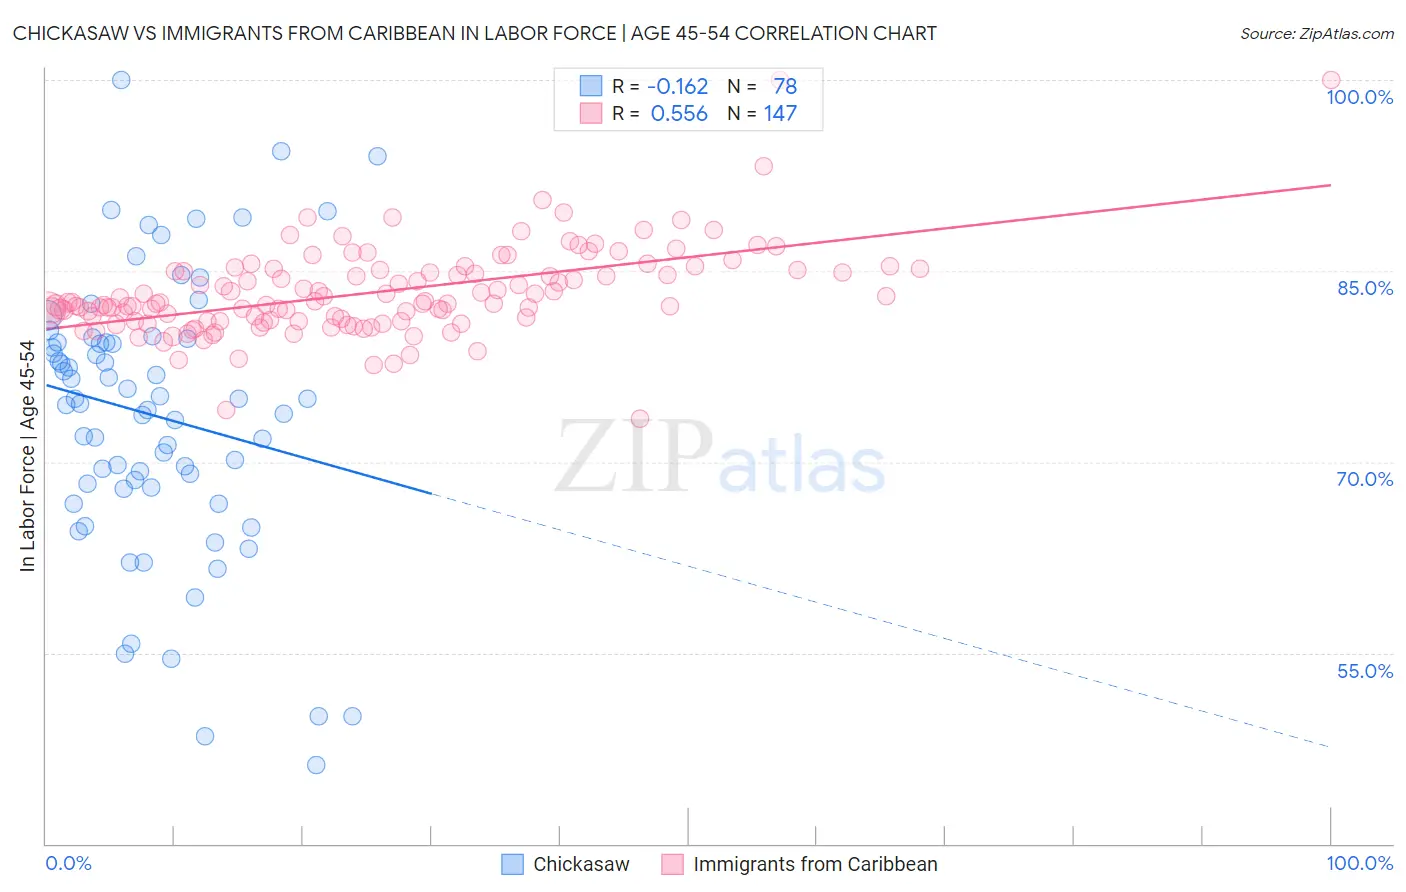
Chickasaw vs Immigrants from Caribbean In Labor Force | Age 45-54 Correlation Chart
The statistical analysis conducted on geographies consisting of 147,675,622 people shows a poor negative correlation between the proportion of Chickasaw and labor force participation rate among population between the ages 45 and 54 in the United States with a correlation coefficient (R) of -0.162 and weighted average of 79.0%. Similarly, the statistical analysis conducted on geographies consisting of 449,588,789 people shows a substantial positive correlation between the proportion of Immigrants from Caribbean and labor force participation rate among population between the ages 45 and 54 in the United States with a correlation coefficient (R) of 0.556 and weighted average of 82.1%, a difference of 3.9%.
In Labor Force | Age 45-54 Correlation Summary
| Measurement | Chickasaw | Immigrants from Caribbean |
| Minimum | 46.2% | 73.4% |
| Maximum | 100.0% | 100.0% |
| Range | 53.8% | 26.6% |
| Mean | 73.6% | 83.3% |
| Median | 74.8% | 82.5% |
| Interquartile 25% (IQ1) | 68.0% | 81.1% |
| Interquartile 75% (IQ3) | 79.4% | 85.1% |
| Interquartile Range (IQR) | 11.4% | 4.0% |
| Standard Deviation (Sample) | 10.8% | 3.6% |
| Standard Deviation (Population) | 10.7% | 3.5% |
Similar Demographics by In Labor Force | Age 45-54
Demographics Similar to Chickasaw by In Labor Force | Age 45-54
In terms of in labor force | age 45-54, the demographic groups most similar to Chickasaw are Cherokee (79.0%, a difference of 0.10%), Comanche (79.2%, a difference of 0.17%), Yaqui (78.9%, a difference of 0.21%), Shoshone (79.3%, a difference of 0.31%), and Black/African American (79.3%, a difference of 0.39%).
| Demographics | Rating | Rank | In Labor Force | Age 45-54 |
| Mexicans | 0.0 /100 | #311 | Tragic 79.8% |
| Immigrants | Mexico | 0.0 /100 | #312 | Tragic 79.7% |
| Colville | 0.0 /100 | #313 | Tragic 79.5% |
| Ottawa | 0.0 /100 | #314 | Tragic 79.5% |
| Blacks/African Americans | 0.0 /100 | #315 | Tragic 79.3% |
| Shoshone | 0.0 /100 | #316 | Tragic 79.3% |
| Comanche | 0.0 /100 | #317 | Tragic 79.2% |
| Chickasaw | 0.0 /100 | #318 | Tragic 79.0% |
| Cherokee | 0.0 /100 | #319 | Tragic 79.0% |
| Yaqui | 0.0 /100 | #320 | Tragic 78.9% |
| Yup'ik | 0.0 /100 | #321 | Tragic 78.6% |
| Crow | 0.0 /100 | #322 | Tragic 78.3% |
| Kiowa | 0.0 /100 | #323 | Tragic 78.3% |
| Dutch West Indians | 0.0 /100 | #324 | Tragic 78.2% |
| Choctaw | 0.0 /100 | #325 | Tragic 78.2% |
Demographics Similar to Immigrants from Caribbean by In Labor Force | Age 45-54
In terms of in labor force | age 45-54, the demographic groups most similar to Immigrants from Caribbean are Immigrants from Oceania (82.1%, a difference of 0.0%), Immigrants from Germany (82.1%, a difference of 0.010%), Immigrants from Jamaica (82.1%, a difference of 0.020%), Cape Verdean (82.1%, a difference of 0.040%), and Immigrants (82.1%, a difference of 0.050%).
| Demographics | Rating | Rank | In Labor Force | Age 45-54 |
| French | 4.1 /100 | #219 | Tragic 82.2% |
| Bahamians | 3.6 /100 | #220 | Tragic 82.2% |
| Panamanians | 3.5 /100 | #221 | Tragic 82.2% |
| Immigrants | Ecuador | 3.4 /100 | #222 | Tragic 82.2% |
| Immigrants | Immigrants | 3.1 /100 | #223 | Tragic 82.1% |
| Immigrants | Jamaica | 2.7 /100 | #224 | Tragic 82.1% |
| Immigrants | Oceania | 2.5 /100 | #225 | Tragic 82.1% |
| Immigrants | Caribbean | 2.5 /100 | #226 | Tragic 82.1% |
| Immigrants | Germany | 2.4 /100 | #227 | Tragic 82.1% |
| Cape Verdeans | 2.1 /100 | #228 | Tragic 82.1% |
| Immigrants | Burma/Myanmar | 1.9 /100 | #229 | Tragic 82.0% |
| Jamaicans | 1.8 /100 | #230 | Tragic 82.0% |
| Immigrants | Senegal | 1.7 /100 | #231 | Tragic 82.0% |
| Immigrants | Portugal | 1.7 /100 | #232 | Tragic 82.0% |
| Malaysians | 1.7 /100 | #233 | Tragic 82.0% |