Nepalese vs Inupiat In Labor Force | Age 45-54
COMPARE
Nepalese
Inupiat
In Labor Force | Age 45-54
In Labor Force | Age 45-54 Comparison
Nepalese
Inupiat
80.5%
IN LABOR FORCE | AGE 45-54
0.0/ 100
METRIC RATING
295th/ 347
METRIC RANK
79.9%
IN LABOR FORCE | AGE 45-54
0.0/ 100
METRIC RATING
310th/ 347
METRIC RANK
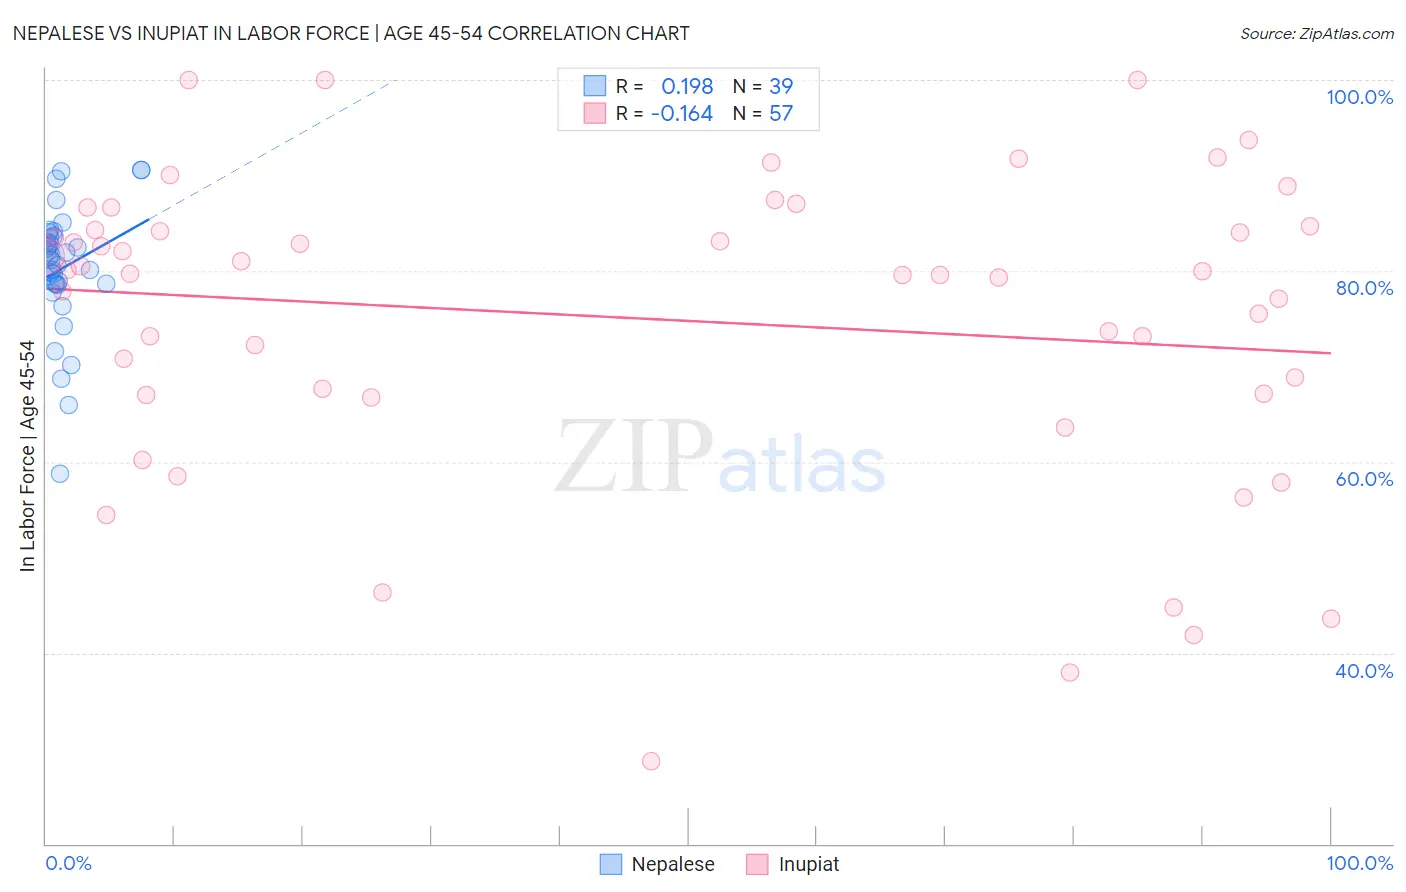
Nepalese vs Inupiat In Labor Force | Age 45-54 Correlation Chart
The statistical analysis conducted on geographies consisting of 24,500,920 people shows a poor positive correlation between the proportion of Nepalese and labor force participation rate among population between the ages 45 and 54 in the United States with a correlation coefficient (R) of 0.198 and weighted average of 80.5%. Similarly, the statistical analysis conducted on geographies consisting of 96,331,160 people shows a poor negative correlation between the proportion of Inupiat and labor force participation rate among population between the ages 45 and 54 in the United States with a correlation coefficient (R) of -0.164 and weighted average of 79.9%, a difference of 0.83%.
In Labor Force | Age 45-54 Correlation Summary
| Measurement | Nepalese | Inupiat |
| Minimum | 58.7% | 28.6% |
| Maximum | 90.6% | 100.0% |
| Range | 31.9% | 71.4% |
| Mean | 80.3% | 75.0% |
| Median | 81.4% | 79.8% |
| Interquartile 25% (IQ1) | 78.6% | 67.1% |
| Interquartile 75% (IQ3) | 83.7% | 84.5% |
| Interquartile Range (IQR) | 5.1% | 17.4% |
| Standard Deviation (Sample) | 6.6% | 16.0% |
| Standard Deviation (Population) | 6.5% | 15.9% |
Demographics Similar to Nepalese and Inupiat by In Labor Force | Age 45-54
In terms of in labor force | age 45-54, the demographic groups most similar to Nepalese are African (80.5%, a difference of 0.040%), Osage (80.6%, a difference of 0.070%), Yakama (80.6%, a difference of 0.070%), Iroquois (80.6%, a difference of 0.090%), and American (80.4%, a difference of 0.21%). Similarly, the demographic groups most similar to Inupiat are Potawatomi (80.0%, a difference of 0.090%), Mexican (79.8%, a difference of 0.11%), Central American Indian (80.0%, a difference of 0.12%), Blackfeet (80.0%, a difference of 0.16%), and Spanish American (80.1%, a difference of 0.24%).
| Demographics | Rating | Rank | In Labor Force | Age 45-54 |
| Iroquois | 0.0 /100 | #292 | Tragic 80.6% |
| Osage | 0.0 /100 | #293 | Tragic 80.6% |
| Yakama | 0.0 /100 | #294 | Tragic 80.6% |
| Nepalese | 0.0 /100 | #295 | Tragic 80.5% |
| Africans | 0.0 /100 | #296 | Tragic 80.5% |
| Americans | 0.0 /100 | #297 | Tragic 80.4% |
| Marshallese | 0.0 /100 | #298 | Tragic 80.3% |
| Dominicans | 0.0 /100 | #299 | Tragic 80.3% |
| Fijians | 0.0 /100 | #300 | Tragic 80.2% |
| Spanish American Indians | 0.0 /100 | #301 | Tragic 80.2% |
| Immigrants | Central America | 0.0 /100 | #302 | Tragic 80.2% |
| Immigrants | Azores | 0.0 /100 | #303 | Tragic 80.1% |
| Hispanics or Latinos | 0.0 /100 | #304 | Tragic 80.1% |
| Immigrants | Dominican Republic | 0.0 /100 | #305 | Tragic 80.1% |
| Spanish Americans | 0.0 /100 | #306 | Tragic 80.1% |
| Blackfeet | 0.0 /100 | #307 | Tragic 80.0% |
| Central American Indians | 0.0 /100 | #308 | Tragic 80.0% |
| Potawatomi | 0.0 /100 | #309 | Tragic 80.0% |
| Inupiat | 0.0 /100 | #310 | Tragic 79.9% |
| Mexicans | 0.0 /100 | #311 | Tragic 79.8% |
| Immigrants | Mexico | 0.0 /100 | #312 | Tragic 79.7% |