Chickasaw vs British In Labor Force | Age 45-54
COMPARE
Chickasaw
British
In Labor Force | Age 45-54
In Labor Force | Age 45-54 Comparison
Chickasaw
British
79.0%
IN LABOR FORCE | AGE 45-54
0.0/ 100
METRIC RATING
318th/ 347
METRIC RANK
82.6%
IN LABOR FORCE | AGE 45-54
25.7/ 100
METRIC RATING
190th/ 347
METRIC RANK
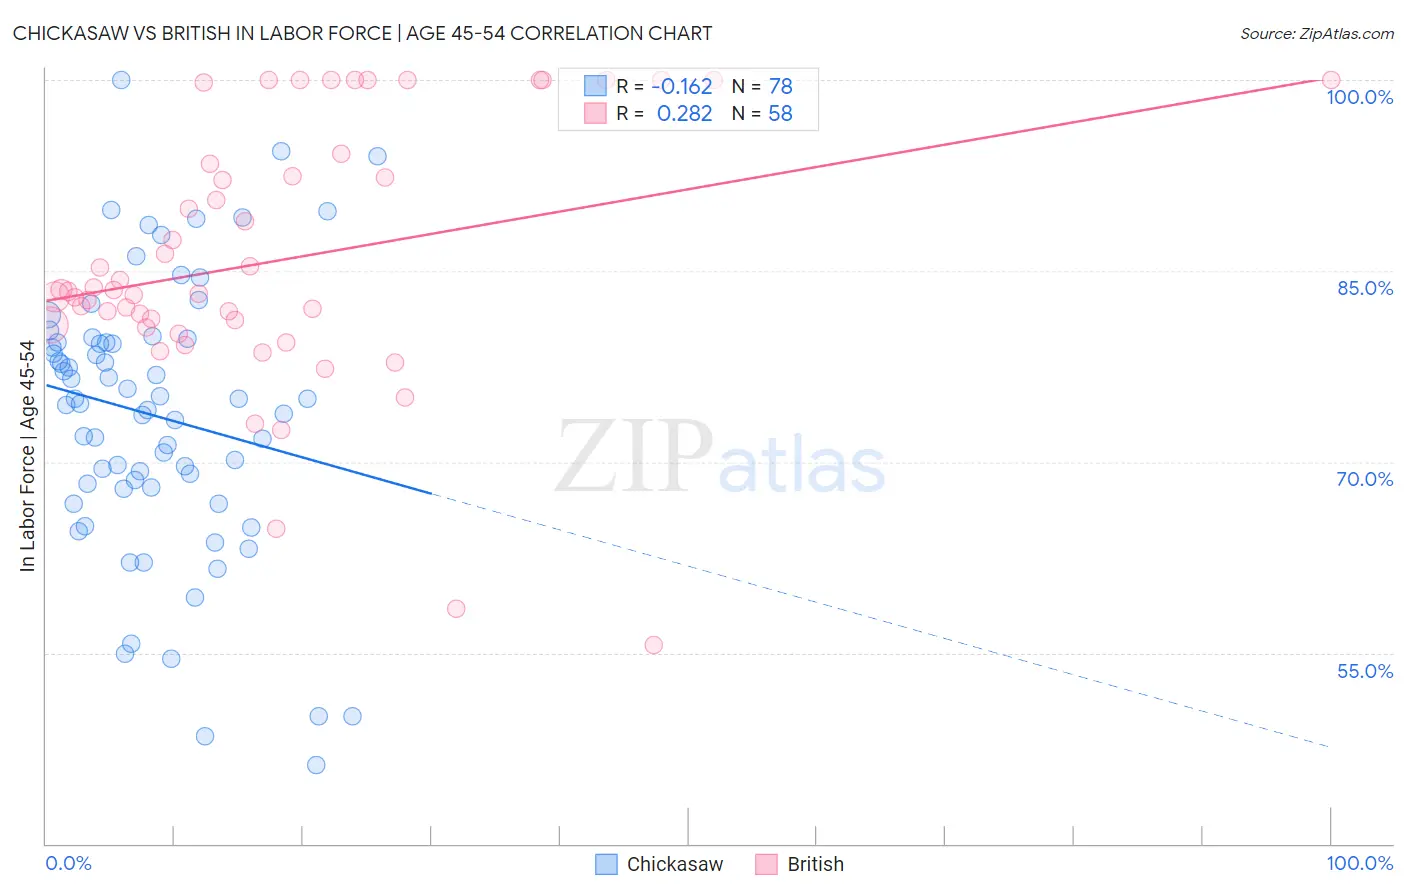
Chickasaw vs British In Labor Force | Age 45-54 Correlation Chart
The statistical analysis conducted on geographies consisting of 147,675,622 people shows a poor negative correlation between the proportion of Chickasaw and labor force participation rate among population between the ages 45 and 54 in the United States with a correlation coefficient (R) of -0.162 and weighted average of 79.0%. Similarly, the statistical analysis conducted on geographies consisting of 530,949,896 people shows a weak positive correlation between the proportion of British and labor force participation rate among population between the ages 45 and 54 in the United States with a correlation coefficient (R) of 0.282 and weighted average of 82.6%, a difference of 4.5%.
In Labor Force | Age 45-54 Correlation Summary
| Measurement | Chickasaw | British |
| Minimum | 46.2% | 55.6% |
| Maximum | 100.0% | 100.0% |
| Range | 53.8% | 44.4% |
| Mean | 73.6% | 85.8% |
| Median | 74.8% | 83.5% |
| Interquartile 25% (IQ1) | 68.0% | 80.8% |
| Interquartile 75% (IQ3) | 79.4% | 93.4% |
| Interquartile Range (IQR) | 11.4% | 12.6% |
| Standard Deviation (Sample) | 10.8% | 10.3% |
| Standard Deviation (Population) | 10.7% | 10.2% |
Similar Demographics by In Labor Force | Age 45-54
Demographics Similar to Chickasaw by In Labor Force | Age 45-54
In terms of in labor force | age 45-54, the demographic groups most similar to Chickasaw are Cherokee (79.0%, a difference of 0.10%), Comanche (79.2%, a difference of 0.17%), Yaqui (78.9%, a difference of 0.21%), Shoshone (79.3%, a difference of 0.31%), and Black/African American (79.3%, a difference of 0.39%).
| Demographics | Rating | Rank | In Labor Force | Age 45-54 |
| Mexicans | 0.0 /100 | #311 | Tragic 79.8% |
| Immigrants | Mexico | 0.0 /100 | #312 | Tragic 79.7% |
| Colville | 0.0 /100 | #313 | Tragic 79.5% |
| Ottawa | 0.0 /100 | #314 | Tragic 79.5% |
| Blacks/African Americans | 0.0 /100 | #315 | Tragic 79.3% |
| Shoshone | 0.0 /100 | #316 | Tragic 79.3% |
| Comanche | 0.0 /100 | #317 | Tragic 79.2% |
| Chickasaw | 0.0 /100 | #318 | Tragic 79.0% |
| Cherokee | 0.0 /100 | #319 | Tragic 79.0% |
| Yaqui | 0.0 /100 | #320 | Tragic 78.9% |
| Yup'ik | 0.0 /100 | #321 | Tragic 78.6% |
| Crow | 0.0 /100 | #322 | Tragic 78.3% |
| Kiowa | 0.0 /100 | #323 | Tragic 78.3% |
| Dutch West Indians | 0.0 /100 | #324 | Tragic 78.2% |
| Choctaw | 0.0 /100 | #325 | Tragic 78.2% |
Demographics Similar to British by In Labor Force | Age 45-54
In terms of in labor force | age 45-54, the demographic groups most similar to British are Syrian (82.6%, a difference of 0.0%), Immigrants from Costa Rica (82.6%, a difference of 0.030%), South African (82.6%, a difference of 0.030%), Armenian (82.5%, a difference of 0.030%), and Irish (82.6%, a difference of 0.040%).
| Demographics | Rating | Rank | In Labor Force | Age 45-54 |
| New Zealanders | 32.7 /100 | #183 | Fair 82.6% |
| Europeans | 32.6 /100 | #184 | Fair 82.6% |
| Immigrants | England | 32.2 /100 | #185 | Fair 82.6% |
| Irish | 29.2 /100 | #186 | Fair 82.6% |
| Immigrants | Costa Rica | 28.3 /100 | #187 | Fair 82.6% |
| South Africans | 28.0 /100 | #188 | Fair 82.6% |
| Syrians | 26.0 /100 | #189 | Fair 82.6% |
| British | 25.7 /100 | #190 | Fair 82.6% |
| Armenians | 23.2 /100 | #191 | Fair 82.5% |
| Immigrants | Iraq | 20.9 /100 | #192 | Fair 82.5% |
| Australians | 20.8 /100 | #193 | Fair 82.5% |
| Immigrants | Norway | 20.7 /100 | #194 | Fair 82.5% |
| Immigrants | Canada | 20.0 /100 | #195 | Fair 82.5% |
| Immigrants | North America | 18.8 /100 | #196 | Poor 82.5% |
| Lebanese | 18.2 /100 | #197 | Poor 82.5% |