Paiute vs Inupiat In Labor Force | Age 45-54
COMPARE
Paiute
Inupiat
In Labor Force | Age 45-54
In Labor Force | Age 45-54 Comparison
Paiute
Inupiat
76.7%
IN LABOR FORCE | AGE 45-54
0.0/ 100
METRIC RATING
336th/ 347
METRIC RANK
79.9%
IN LABOR FORCE | AGE 45-54
0.0/ 100
METRIC RATING
310th/ 347
METRIC RANK
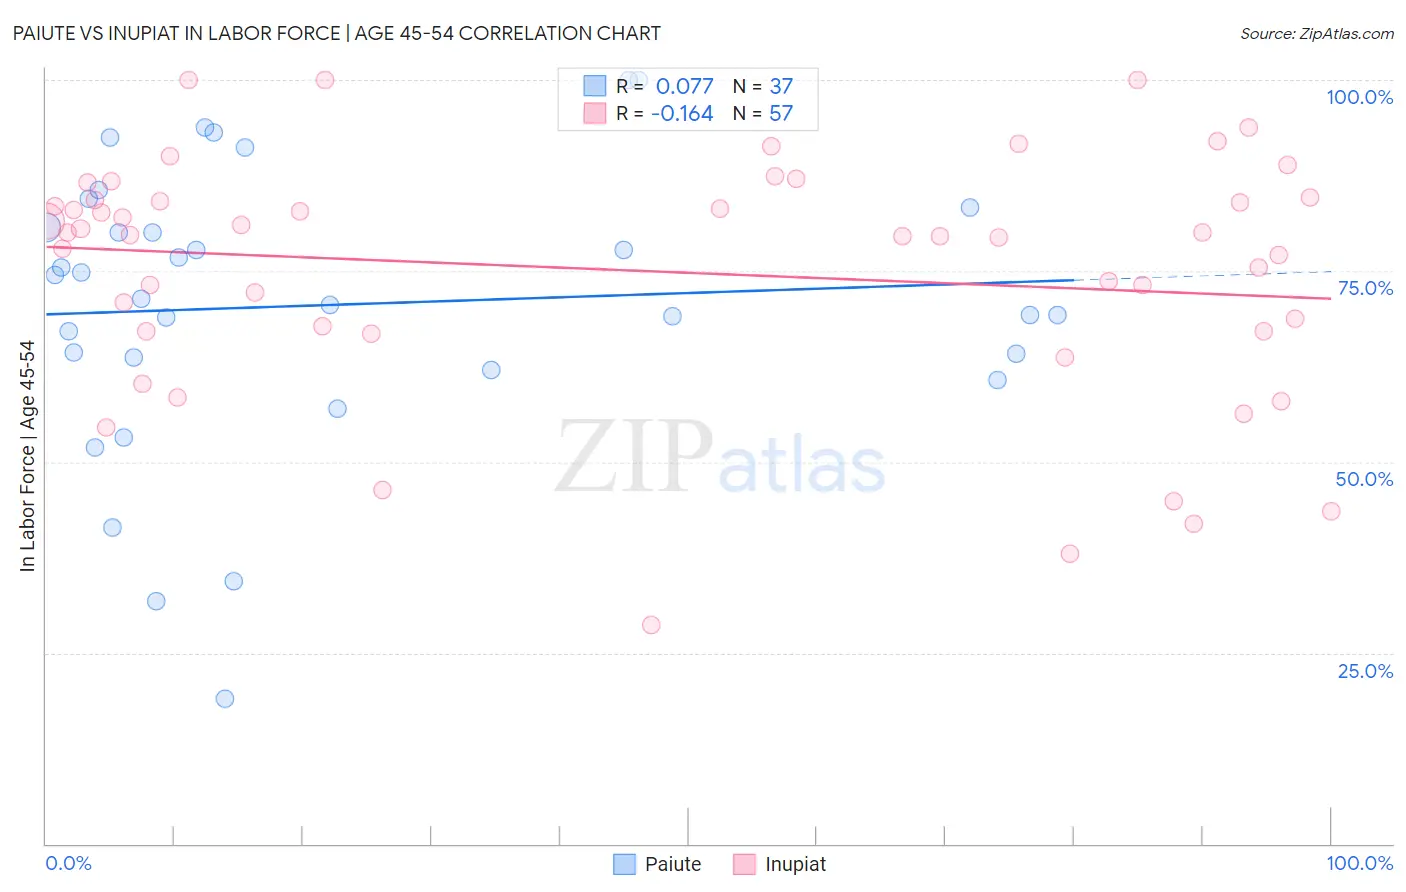
Paiute vs Inupiat In Labor Force | Age 45-54 Correlation Chart
The statistical analysis conducted on geographies consisting of 58,396,210 people shows a slight positive correlation between the proportion of Paiute and labor force participation rate among population between the ages 45 and 54 in the United States with a correlation coefficient (R) of 0.077 and weighted average of 76.7%. Similarly, the statistical analysis conducted on geographies consisting of 96,331,160 people shows a poor negative correlation between the proportion of Inupiat and labor force participation rate among population between the ages 45 and 54 in the United States with a correlation coefficient (R) of -0.164 and weighted average of 79.9%, a difference of 4.2%.
In Labor Force | Age 45-54 Correlation Summary
| Measurement | Paiute | Inupiat |
| Minimum | 19.0% | 28.6% |
| Maximum | 100.0% | 100.0% |
| Range | 81.0% | 71.4% |
| Mean | 70.5% | 75.0% |
| Median | 71.4% | 79.8% |
| Interquartile 25% (IQ1) | 62.9% | 67.1% |
| Interquartile 75% (IQ3) | 82.0% | 84.5% |
| Interquartile Range (IQR) | 19.1% | 17.4% |
| Standard Deviation (Sample) | 18.4% | 16.0% |
| Standard Deviation (Population) | 18.2% | 15.9% |
Similar Demographics by In Labor Force | Age 45-54
Demographics Similar to Paiute by In Labor Force | Age 45-54
In terms of in labor force | age 45-54, the demographic groups most similar to Paiute are Ute (76.6%, a difference of 0.060%), Yuman (76.3%, a difference of 0.47%), Arapaho (77.1%, a difference of 0.54%), Native/Alaskan (77.1%, a difference of 0.61%), and Apache (77.1%, a difference of 0.61%).
| Demographics | Rating | Rank | In Labor Force | Age 45-54 |
| Creek | 0.0 /100 | #329 | Tragic 77.7% |
| Cheyenne | 0.0 /100 | #330 | Tragic 77.6% |
| Tsimshian | 0.0 /100 | #331 | Tragic 77.4% |
| Menominee | 0.0 /100 | #332 | Tragic 77.4% |
| Natives/Alaskans | 0.0 /100 | #333 | Tragic 77.1% |
| Apache | 0.0 /100 | #334 | Tragic 77.1% |
| Arapaho | 0.0 /100 | #335 | Tragic 77.1% |
| Paiute | 0.0 /100 | #336 | Tragic 76.7% |
| Ute | 0.0 /100 | #337 | Tragic 76.6% |
| Yuman | 0.0 /100 | #338 | Tragic 76.3% |
| Puerto Ricans | 0.0 /100 | #339 | Tragic 75.9% |
| Lumbee | 0.0 /100 | #340 | Tragic 75.6% |
| Pueblo | 0.0 /100 | #341 | Tragic 75.5% |
| Tohono O'odham | 0.0 /100 | #342 | Tragic 75.1% |
| Hopi | 0.0 /100 | #343 | Tragic 75.0% |
Demographics Similar to Inupiat by In Labor Force | Age 45-54
In terms of in labor force | age 45-54, the demographic groups most similar to Inupiat are Potawatomi (80.0%, a difference of 0.090%), Mexican (79.8%, a difference of 0.11%), Central American Indian (80.0%, a difference of 0.12%), Blackfeet (80.0%, a difference of 0.16%), and Spanish American (80.1%, a difference of 0.24%).
| Demographics | Rating | Rank | In Labor Force | Age 45-54 |
| Immigrants | Azores | 0.0 /100 | #303 | Tragic 80.1% |
| Hispanics or Latinos | 0.0 /100 | #304 | Tragic 80.1% |
| Immigrants | Dominican Republic | 0.0 /100 | #305 | Tragic 80.1% |
| Spanish Americans | 0.0 /100 | #306 | Tragic 80.1% |
| Blackfeet | 0.0 /100 | #307 | Tragic 80.0% |
| Central American Indians | 0.0 /100 | #308 | Tragic 80.0% |
| Potawatomi | 0.0 /100 | #309 | Tragic 80.0% |
| Inupiat | 0.0 /100 | #310 | Tragic 79.9% |
| Mexicans | 0.0 /100 | #311 | Tragic 79.8% |
| Immigrants | Mexico | 0.0 /100 | #312 | Tragic 79.7% |
| Colville | 0.0 /100 | #313 | Tragic 79.5% |
| Ottawa | 0.0 /100 | #314 | Tragic 79.5% |
| Blacks/African Americans | 0.0 /100 | #315 | Tragic 79.3% |
| Shoshone | 0.0 /100 | #316 | Tragic 79.3% |
| Comanche | 0.0 /100 | #317 | Tragic 79.2% |