Immigrants from Ecuador vs Inupiat In Labor Force | Age 45-54
COMPARE
Immigrants from Ecuador
Inupiat
In Labor Force | Age 45-54
In Labor Force | Age 45-54 Comparison
Immigrants from Ecuador
Inupiat
82.2%
IN LABOR FORCE | AGE 45-54
3.4/ 100
METRIC RATING
222nd/ 347
METRIC RANK
79.9%
IN LABOR FORCE | AGE 45-54
0.0/ 100
METRIC RATING
310th/ 347
METRIC RANK
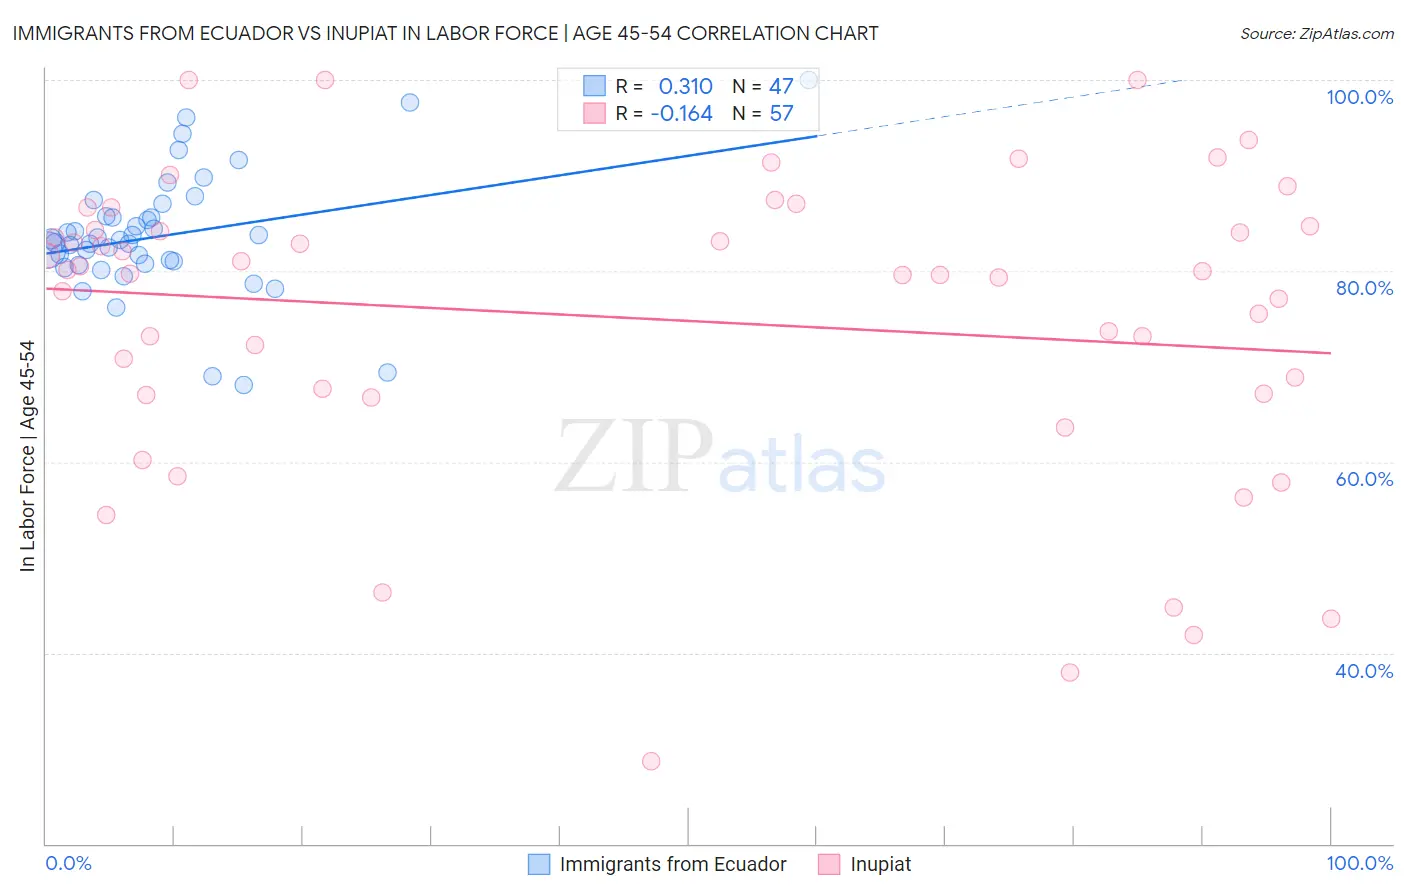
Immigrants from Ecuador vs Inupiat In Labor Force | Age 45-54 Correlation Chart
The statistical analysis conducted on geographies consisting of 270,878,287 people shows a mild positive correlation between the proportion of Immigrants from Ecuador and labor force participation rate among population between the ages 45 and 54 in the United States with a correlation coefficient (R) of 0.310 and weighted average of 82.2%. Similarly, the statistical analysis conducted on geographies consisting of 96,331,160 people shows a poor negative correlation between the proportion of Inupiat and labor force participation rate among population between the ages 45 and 54 in the United States with a correlation coefficient (R) of -0.164 and weighted average of 79.9%, a difference of 2.9%.
In Labor Force | Age 45-54 Correlation Summary
| Measurement | Immigrants from Ecuador | Inupiat |
| Minimum | 68.0% | 28.6% |
| Maximum | 100.0% | 100.0% |
| Range | 32.0% | 71.4% |
| Mean | 83.7% | 75.0% |
| Median | 83.2% | 79.8% |
| Interquartile 25% (IQ1) | 80.7% | 67.1% |
| Interquartile 75% (IQ3) | 85.7% | 84.5% |
| Interquartile Range (IQR) | 5.0% | 17.4% |
| Standard Deviation (Sample) | 6.4% | 16.0% |
| Standard Deviation (Population) | 6.4% | 15.9% |
Similar Demographics by In Labor Force | Age 45-54
Demographics Similar to Immigrants from Ecuador by In Labor Force | Age 45-54
In terms of in labor force | age 45-54, the demographic groups most similar to Immigrants from Ecuador are Panamanian (82.2%, a difference of 0.0%), Bahamian (82.2%, a difference of 0.010%), Immigrants (82.1%, a difference of 0.020%), French (82.2%, a difference of 0.040%), and English (82.2%, a difference of 0.060%).
| Demographics | Rating | Rank | In Labor Force | Age 45-54 |
| Iraqis | 5.6 /100 | #215 | Tragic 82.2% |
| Scottish | 5.3 /100 | #216 | Tragic 82.2% |
| Portuguese | 4.7 /100 | #217 | Tragic 82.2% |
| English | 4.4 /100 | #218 | Tragic 82.2% |
| French | 4.1 /100 | #219 | Tragic 82.2% |
| Bahamians | 3.6 /100 | #220 | Tragic 82.2% |
| Panamanians | 3.5 /100 | #221 | Tragic 82.2% |
| Immigrants | Ecuador | 3.4 /100 | #222 | Tragic 82.2% |
| Immigrants | Immigrants | 3.1 /100 | #223 | Tragic 82.1% |
| Immigrants | Jamaica | 2.7 /100 | #224 | Tragic 82.1% |
| Immigrants | Oceania | 2.5 /100 | #225 | Tragic 82.1% |
| Immigrants | Caribbean | 2.5 /100 | #226 | Tragic 82.1% |
| Immigrants | Germany | 2.4 /100 | #227 | Tragic 82.1% |
| Cape Verdeans | 2.1 /100 | #228 | Tragic 82.1% |
| Immigrants | Burma/Myanmar | 1.9 /100 | #229 | Tragic 82.0% |
Demographics Similar to Inupiat by In Labor Force | Age 45-54
In terms of in labor force | age 45-54, the demographic groups most similar to Inupiat are Potawatomi (80.0%, a difference of 0.090%), Mexican (79.8%, a difference of 0.11%), Central American Indian (80.0%, a difference of 0.12%), Blackfeet (80.0%, a difference of 0.16%), and Spanish American (80.1%, a difference of 0.24%).
| Demographics | Rating | Rank | In Labor Force | Age 45-54 |
| Immigrants | Azores | 0.0 /100 | #303 | Tragic 80.1% |
| Hispanics or Latinos | 0.0 /100 | #304 | Tragic 80.1% |
| Immigrants | Dominican Republic | 0.0 /100 | #305 | Tragic 80.1% |
| Spanish Americans | 0.0 /100 | #306 | Tragic 80.1% |
| Blackfeet | 0.0 /100 | #307 | Tragic 80.0% |
| Central American Indians | 0.0 /100 | #308 | Tragic 80.0% |
| Potawatomi | 0.0 /100 | #309 | Tragic 80.0% |
| Inupiat | 0.0 /100 | #310 | Tragic 79.9% |
| Mexicans | 0.0 /100 | #311 | Tragic 79.8% |
| Immigrants | Mexico | 0.0 /100 | #312 | Tragic 79.7% |
| Colville | 0.0 /100 | #313 | Tragic 79.5% |
| Ottawa | 0.0 /100 | #314 | Tragic 79.5% |
| Blacks/African Americans | 0.0 /100 | #315 | Tragic 79.3% |
| Shoshone | 0.0 /100 | #316 | Tragic 79.3% |
| Comanche | 0.0 /100 | #317 | Tragic 79.2% |