Liberian vs Immigrants from South America In Labor Force | Age 20-24
COMPARE
Liberian
Immigrants from South America
In Labor Force | Age 20-24
In Labor Force | Age 20-24 Comparison
Liberians
Immigrants from South America
78.0%
IN LABOR FORCE | AGE 20-24
100.0/ 100
METRIC RATING
24th/ 347
METRIC RANK
73.3%
IN LABOR FORCE | AGE 20-24
0.2/ 100
METRIC RATING
275th/ 347
METRIC RANK
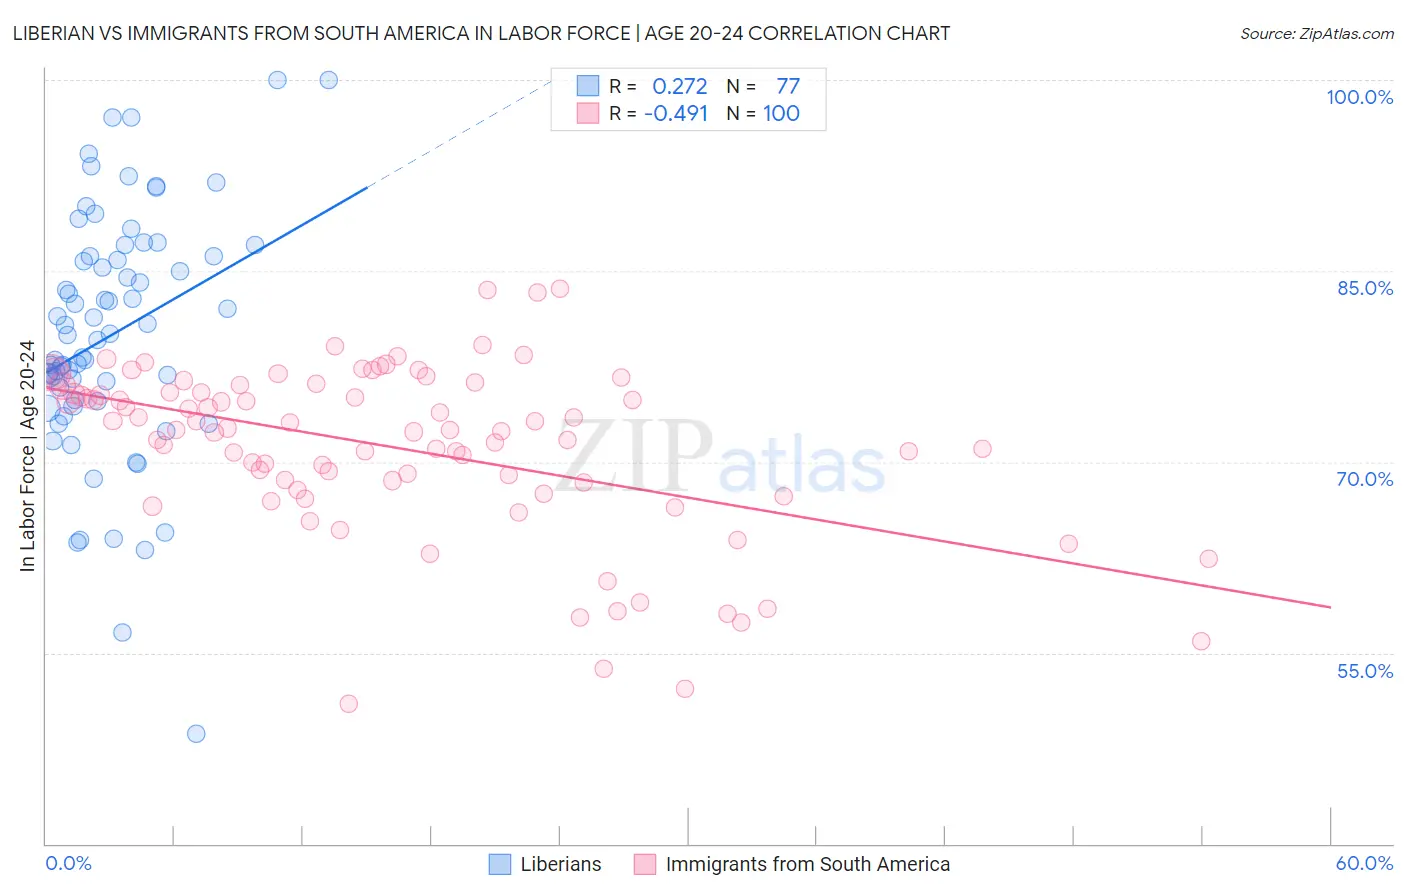
Liberian vs Immigrants from South America In Labor Force | Age 20-24 Correlation Chart
The statistical analysis conducted on geographies consisting of 118,080,661 people shows a weak positive correlation between the proportion of Liberians and labor force participation rate among population between the ages 20 and 24 in the United States with a correlation coefficient (R) of 0.272 and weighted average of 78.0%. Similarly, the statistical analysis conducted on geographies consisting of 486,128,145 people shows a moderate negative correlation between the proportion of Immigrants from South America and labor force participation rate among population between the ages 20 and 24 in the United States with a correlation coefficient (R) of -0.491 and weighted average of 73.3%, a difference of 6.3%.
In Labor Force | Age 20-24 Correlation Summary
| Measurement | Liberian | Immigrants from South America |
| Minimum | 48.6% | 51.0% |
| Maximum | 100.0% | 83.6% |
| Range | 51.4% | 32.6% |
| Mean | 80.0% | 71.1% |
| Median | 80.0% | 72.5% |
| Interquartile 25% (IQ1) | 74.8% | 68.1% |
| Interquartile 75% (IQ3) | 86.2% | 75.7% |
| Interquartile Range (IQR) | 11.4% | 7.6% |
| Standard Deviation (Sample) | 9.6% | 6.8% |
| Standard Deviation (Population) | 9.5% | 6.7% |
Similar Demographics by In Labor Force | Age 20-24
Demographics Similar to Liberians by In Labor Force | Age 20-24
In terms of in labor force | age 20-24, the demographic groups most similar to Liberians are Yugoslavian (78.0%, a difference of 0.0%), Pennsylvania German (78.0%, a difference of 0.010%), Tlingit-Haida (77.9%, a difference of 0.040%), Tongan (77.9%, a difference of 0.060%), and Puget Sound Salish (78.0%, a difference of 0.070%).
| Demographics | Rating | Rank | In Labor Force | Age 20-24 |
| Cape Verdeans | 100.0 /100 | #17 | Exceptional 78.3% |
| Immigrants | Bosnia and Herzegovina | 100.0 /100 | #18 | Exceptional 78.1% |
| Bangladeshis | 100.0 /100 | #19 | Exceptional 78.1% |
| French Canadians | 100.0 /100 | #20 | Exceptional 78.1% |
| Puget Sound Salish | 100.0 /100 | #21 | Exceptional 78.0% |
| Pennsylvania Germans | 100.0 /100 | #22 | Exceptional 78.0% |
| Yugoslavians | 100.0 /100 | #23 | Exceptional 78.0% |
| Liberians | 100.0 /100 | #24 | Exceptional 78.0% |
| Tlingit-Haida | 100.0 /100 | #25 | Exceptional 77.9% |
| Tongans | 100.0 /100 | #26 | Exceptional 77.9% |
| Immigrants | Micronesia | 100.0 /100 | #27 | Exceptional 77.8% |
| Belgians | 100.0 /100 | #28 | Exceptional 77.8% |
| Slovaks | 100.0 /100 | #29 | Exceptional 77.7% |
| Swiss | 100.0 /100 | #30 | Exceptional 77.7% |
| Poles | 100.0 /100 | #31 | Exceptional 77.6% |
Demographics Similar to Immigrants from South America by In Labor Force | Age 20-24
In terms of in labor force | age 20-24, the demographic groups most similar to Immigrants from South America are Mongolian (73.3%, a difference of 0.010%), Immigrants from Malaysia (73.3%, a difference of 0.020%), Cypriot (73.3%, a difference of 0.040%), Immigrants from Colombia (73.4%, a difference of 0.050%), and Venezuelan (73.3%, a difference of 0.050%).
| Demographics | Rating | Rank | In Labor Force | Age 20-24 |
| South Americans | 0.4 /100 | #268 | Tragic 73.5% |
| Colombians | 0.3 /100 | #269 | Tragic 73.5% |
| Immigrants | Russia | 0.3 /100 | #270 | Tragic 73.5% |
| Immigrants | Indonesia | 0.3 /100 | #271 | Tragic 73.4% |
| Belizeans | 0.3 /100 | #272 | Tragic 73.4% |
| Cheyenne | 0.2 /100 | #273 | Tragic 73.4% |
| Immigrants | Colombia | 0.2 /100 | #274 | Tragic 73.4% |
| Immigrants | South America | 0.2 /100 | #275 | Tragic 73.3% |
| Mongolians | 0.2 /100 | #276 | Tragic 73.3% |
| Immigrants | Malaysia | 0.2 /100 | #277 | Tragic 73.3% |
| Cypriots | 0.2 /100 | #278 | Tragic 73.3% |
| Venezuelans | 0.2 /100 | #279 | Tragic 73.3% |
| Bahamians | 0.1 /100 | #280 | Tragic 73.3% |
| Immigrants | Venezuela | 0.1 /100 | #281 | Tragic 73.2% |
| Immigrants | Spain | 0.1 /100 | #282 | Tragic 73.2% |