Nigerian vs Immigrants from South America In Labor Force | Age 20-24
COMPARE
Nigerian
Immigrants from South America
In Labor Force | Age 20-24
In Labor Force | Age 20-24 Comparison
Nigerians
Immigrants from South America
74.7%
IN LABOR FORCE | AGE 20-24
21.9/ 100
METRIC RATING
200th/ 347
METRIC RANK
73.3%
IN LABOR FORCE | AGE 20-24
0.2/ 100
METRIC RATING
275th/ 347
METRIC RANK
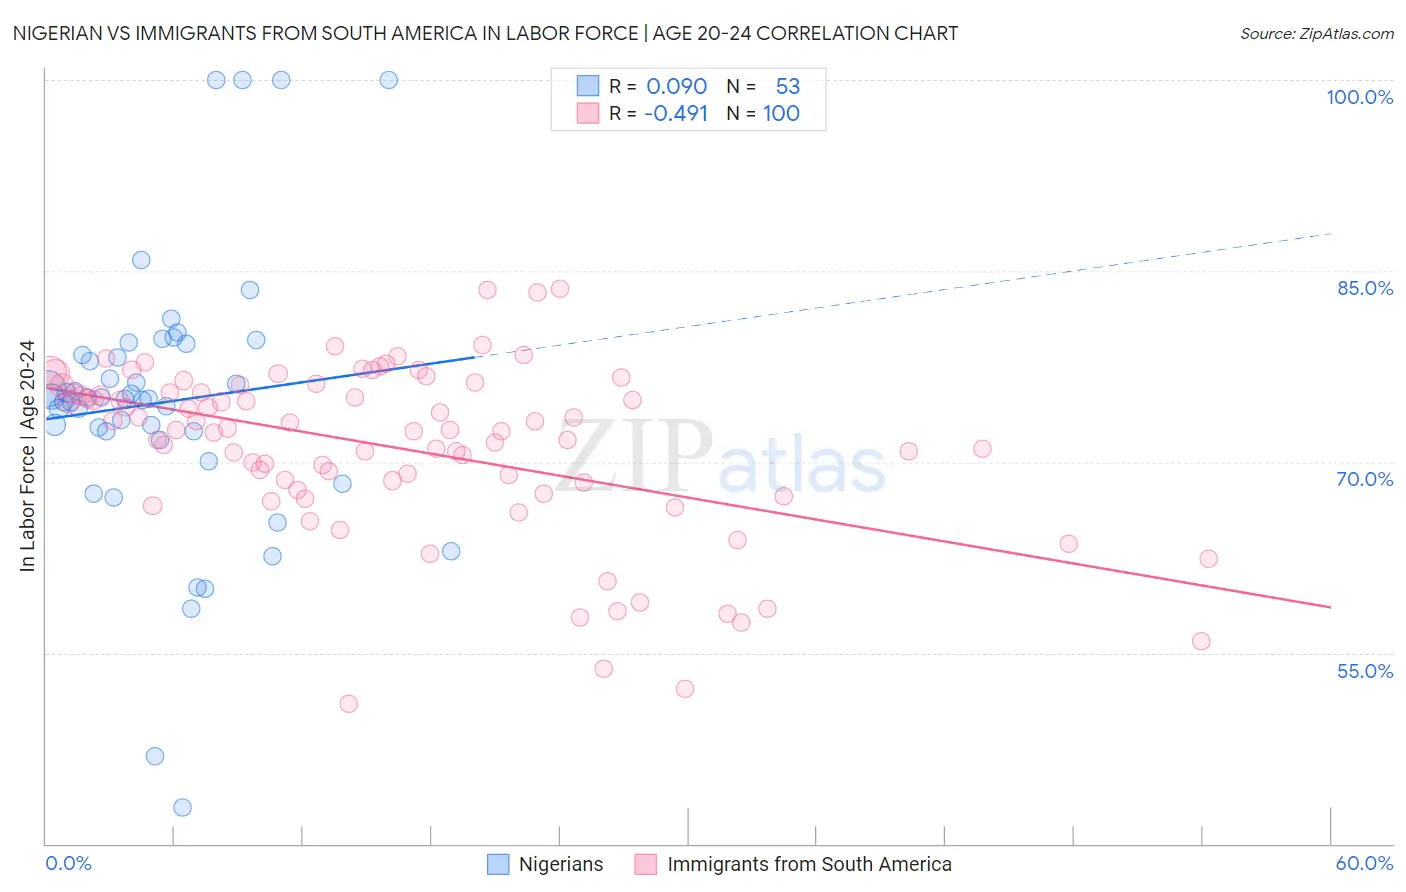
Nigerian vs Immigrants from South America In Labor Force | Age 20-24 Correlation Chart
The statistical analysis conducted on geographies consisting of 332,759,709 people shows a slight positive correlation between the proportion of Nigerians and labor force participation rate among population between the ages 20 and 24 in the United States with a correlation coefficient (R) of 0.090 and weighted average of 74.7%. Similarly, the statistical analysis conducted on geographies consisting of 486,128,145 people shows a moderate negative correlation between the proportion of Immigrants from South America and labor force participation rate among population between the ages 20 and 24 in the United States with a correlation coefficient (R) of -0.491 and weighted average of 73.3%, a difference of 1.8%.
In Labor Force | Age 20-24 Correlation Summary
| Measurement | Nigerian | Immigrants from South America |
| Minimum | 42.8% | 51.0% |
| Maximum | 100.0% | 83.6% |
| Range | 57.2% | 32.6% |
| Mean | 74.7% | 71.1% |
| Median | 74.9% | 72.5% |
| Interquartile 25% (IQ1) | 72.1% | 68.1% |
| Interquartile 75% (IQ3) | 78.9% | 75.7% |
| Interquartile Range (IQR) | 6.8% | 7.6% |
| Standard Deviation (Sample) | 10.8% | 6.8% |
| Standard Deviation (Population) | 10.7% | 6.7% |
Similar Demographics by In Labor Force | Age 20-24
Demographics Similar to Nigerians by In Labor Force | Age 20-24
In terms of in labor force | age 20-24, the demographic groups most similar to Nigerians are Choctaw (74.7%, a difference of 0.010%), Taiwanese (74.7%, a difference of 0.030%), Moroccan (74.7%, a difference of 0.030%), Immigrants from Nigeria (74.7%, a difference of 0.050%), and Panamanian (74.7%, a difference of 0.060%).
| Demographics | Rating | Rank | In Labor Force | Age 20-24 |
| Alsatians | 27.1 /100 | #193 | Fair 74.8% |
| Immigrants | Denmark | 25.8 /100 | #194 | Fair 74.8% |
| Eastern Europeans | 25.4 /100 | #195 | Fair 74.8% |
| Immigrants | Vietnam | 25.1 /100 | #196 | Fair 74.7% |
| Panamanians | 25.0 /100 | #197 | Fair 74.7% |
| Immigrants | Nigeria | 24.2 /100 | #198 | Fair 74.7% |
| Taiwanese | 23.2 /100 | #199 | Fair 74.7% |
| Nigerians | 21.9 /100 | #200 | Fair 74.7% |
| Choctaw | 21.4 /100 | #201 | Fair 74.7% |
| Moroccans | 20.4 /100 | #202 | Fair 74.7% |
| Immigrants | Northern Africa | 17.9 /100 | #203 | Poor 74.6% |
| Immigrants | Italy | 17.6 /100 | #204 | Poor 74.6% |
| Inupiat | 17.6 /100 | #205 | Poor 74.6% |
| Sioux | 17.5 /100 | #206 | Poor 74.6% |
| Albanians | 16.2 /100 | #207 | Poor 74.6% |
Demographics Similar to Immigrants from South America by In Labor Force | Age 20-24
In terms of in labor force | age 20-24, the demographic groups most similar to Immigrants from South America are Mongolian (73.3%, a difference of 0.010%), Immigrants from Malaysia (73.3%, a difference of 0.020%), Cypriot (73.3%, a difference of 0.040%), Immigrants from Colombia (73.4%, a difference of 0.050%), and Venezuelan (73.3%, a difference of 0.050%).
| Demographics | Rating | Rank | In Labor Force | Age 20-24 |
| South Americans | 0.4 /100 | #268 | Tragic 73.5% |
| Colombians | 0.3 /100 | #269 | Tragic 73.5% |
| Immigrants | Russia | 0.3 /100 | #270 | Tragic 73.5% |
| Immigrants | Indonesia | 0.3 /100 | #271 | Tragic 73.4% |
| Belizeans | 0.3 /100 | #272 | Tragic 73.4% |
| Cheyenne | 0.2 /100 | #273 | Tragic 73.4% |
| Immigrants | Colombia | 0.2 /100 | #274 | Tragic 73.4% |
| Immigrants | South America | 0.2 /100 | #275 | Tragic 73.3% |
| Mongolians | 0.2 /100 | #276 | Tragic 73.3% |
| Immigrants | Malaysia | 0.2 /100 | #277 | Tragic 73.3% |
| Cypriots | 0.2 /100 | #278 | Tragic 73.3% |
| Venezuelans | 0.2 /100 | #279 | Tragic 73.3% |
| Bahamians | 0.1 /100 | #280 | Tragic 73.3% |
| Immigrants | Venezuela | 0.1 /100 | #281 | Tragic 73.2% |
| Immigrants | Spain | 0.1 /100 | #282 | Tragic 73.2% |