Celtic vs Immigrants from Austria In Labor Force | Age 20-24
COMPARE
Celtic
Immigrants from Austria
In Labor Force | Age 20-24
In Labor Force | Age 20-24 Comparison
Celtics
Immigrants from Austria
77.1%
IN LABOR FORCE | AGE 20-24
99.9/ 100
METRIC RATING
54th/ 347
METRIC RANK
75.6%
IN LABOR FORCE | AGE 20-24
88.8/ 100
METRIC RATING
130th/ 347
METRIC RANK
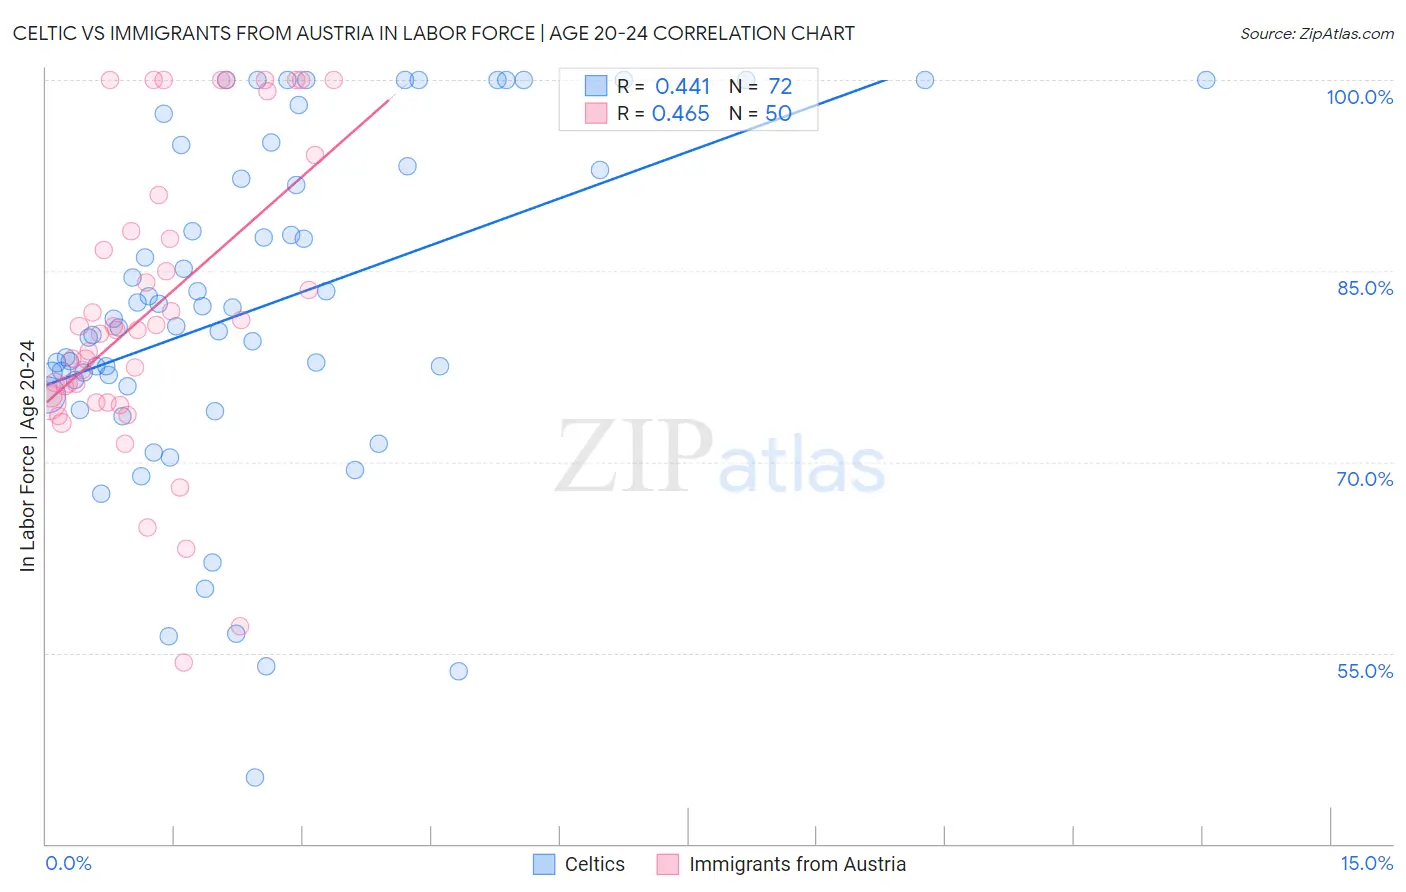
Celtic vs Immigrants from Austria In Labor Force | Age 20-24 Correlation Chart
The statistical analysis conducted on geographies consisting of 168,822,890 people shows a moderate positive correlation between the proportion of Celtics and labor force participation rate among population between the ages 20 and 24 in the United States with a correlation coefficient (R) of 0.441 and weighted average of 77.1%. Similarly, the statistical analysis conducted on geographies consisting of 167,871,666 people shows a moderate positive correlation between the proportion of Immigrants from Austria and labor force participation rate among population between the ages 20 and 24 in the United States with a correlation coefficient (R) of 0.465 and weighted average of 75.6%, a difference of 1.9%.
In Labor Force | Age 20-24 Correlation Summary
| Measurement | Celtic | Immigrants from Austria |
| Minimum | 45.2% | 54.3% |
| Maximum | 100.0% | 100.0% |
| Range | 54.8% | 45.7% |
| Mean | 82.1% | 81.9% |
| Median | 81.0% | 80.3% |
| Interquartile 25% (IQ1) | 76.2% | 74.7% |
| Interquartile 75% (IQ3) | 93.0% | 88.1% |
| Interquartile Range (IQR) | 16.9% | 13.4% |
| Standard Deviation (Sample) | 13.2% | 11.6% |
| Standard Deviation (Population) | 13.1% | 11.5% |
Similar Demographics by In Labor Force | Age 20-24
Demographics Similar to Celtics by In Labor Force | Age 20-24
In terms of in labor force | age 20-24, the demographic groups most similar to Celtics are Immigrants from Liberia (77.1%, a difference of 0.020%), European (77.1%, a difference of 0.030%), Chippewa (77.1%, a difference of 0.040%), Hawaiian (77.0%, a difference of 0.060%), and Scotch-Irish (77.0%, a difference of 0.090%).
| Demographics | Rating | Rank | In Labor Force | Age 20-24 |
| Ethiopians | 100.0 /100 | #47 | Exceptional 77.3% |
| Serbians | 100.0 /100 | #48 | Exceptional 77.3% |
| Chinese | 100.0 /100 | #49 | Exceptional 77.3% |
| Malaysians | 100.0 /100 | #50 | Exceptional 77.2% |
| Croatians | 100.0 /100 | #51 | Exceptional 77.2% |
| Indonesians | 100.0 /100 | #52 | Exceptional 77.2% |
| Immigrants | Azores | 100.0 /100 | #53 | Exceptional 77.2% |
| Celtics | 99.9 /100 | #54 | Exceptional 77.1% |
| Immigrants | Liberia | 99.9 /100 | #55 | Exceptional 77.1% |
| Europeans | 99.9 /100 | #56 | Exceptional 77.1% |
| Chippewa | 99.9 /100 | #57 | Exceptional 77.1% |
| Hawaiians | 99.9 /100 | #58 | Exceptional 77.0% |
| Scotch-Irish | 99.9 /100 | #59 | Exceptional 77.0% |
| Kenyans | 99.9 /100 | #60 | Exceptional 77.0% |
| Immigrants | Eritrea | 99.9 /100 | #61 | Exceptional 77.0% |
Demographics Similar to Immigrants from Austria by In Labor Force | Age 20-24
In terms of in labor force | age 20-24, the demographic groups most similar to Immigrants from Austria are Iroquois (75.6%, a difference of 0.010%), Immigrants from Jordan (75.6%, a difference of 0.010%), Palestinian (75.6%, a difference of 0.010%), Immigrants from Afghanistan (75.6%, a difference of 0.020%), and Zimbabwean (75.6%, a difference of 0.020%).
| Demographics | Rating | Rank | In Labor Force | Age 20-24 |
| Immigrants | Bulgaria | 94.1 /100 | #123 | Exceptional 75.8% |
| Immigrants | Sierra Leone | 93.8 /100 | #124 | Exceptional 75.8% |
| Immigrants | Scotland | 93.7 /100 | #125 | Exceptional 75.8% |
| Brazilians | 93.0 /100 | #126 | Exceptional 75.8% |
| Sub-Saharan Africans | 90.9 /100 | #127 | Exceptional 75.7% |
| Immigrants | Afghanistan | 89.4 /100 | #128 | Excellent 75.6% |
| Iroquois | 89.1 /100 | #129 | Excellent 75.6% |
| Immigrants | Austria | 88.8 /100 | #130 | Excellent 75.6% |
| Immigrants | Jordan | 88.5 /100 | #131 | Excellent 75.6% |
| Palestinians | 88.4 /100 | #132 | Excellent 75.6% |
| Zimbabweans | 88.2 /100 | #133 | Excellent 75.6% |
| Estonians | 87.1 /100 | #134 | Excellent 75.6% |
| Yaqui | 85.5 /100 | #135 | Excellent 75.5% |
| Immigrants | Brazil | 84.8 /100 | #136 | Excellent 75.5% |
| Jordanians | 84.8 /100 | #137 | Excellent 75.5% |