Celtic vs Immigrants from Hong Kong In Labor Force | Age 20-24
COMPARE
Celtic
Immigrants from Hong Kong
In Labor Force | Age 20-24
In Labor Force | Age 20-24 Comparison
Celtics
Immigrants from Hong Kong
77.1%
IN LABOR FORCE | AGE 20-24
99.9/ 100
METRIC RATING
54th/ 347
METRIC RANK
71.6%
IN LABOR FORCE | AGE 20-24
0.0/ 100
METRIC RATING
318th/ 347
METRIC RANK
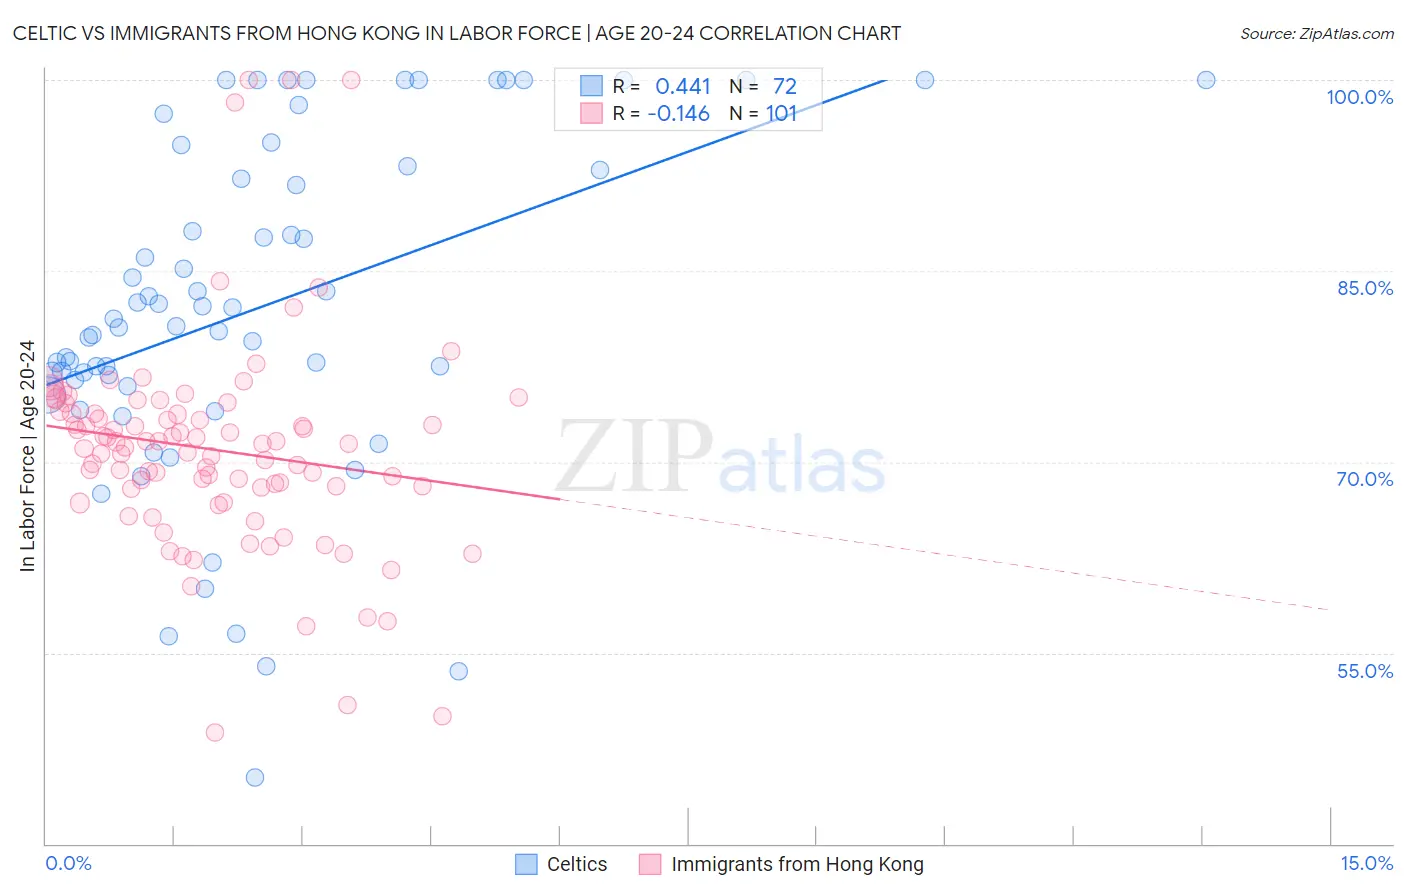
Celtic vs Immigrants from Hong Kong In Labor Force | Age 20-24 Correlation Chart
The statistical analysis conducted on geographies consisting of 168,822,890 people shows a moderate positive correlation between the proportion of Celtics and labor force participation rate among population between the ages 20 and 24 in the United States with a correlation coefficient (R) of 0.441 and weighted average of 77.1%. Similarly, the statistical analysis conducted on geographies consisting of 253,918,765 people shows a poor negative correlation between the proportion of Immigrants from Hong Kong and labor force participation rate among population between the ages 20 and 24 in the United States with a correlation coefficient (R) of -0.146 and weighted average of 71.6%, a difference of 7.7%.
In Labor Force | Age 20-24 Correlation Summary
| Measurement | Celtic | Immigrants from Hong Kong |
| Minimum | 45.2% | 48.7% |
| Maximum | 100.0% | 100.0% |
| Range | 54.8% | 51.3% |
| Mean | 82.1% | 71.0% |
| Median | 81.0% | 71.4% |
| Interquartile 25% (IQ1) | 76.2% | 67.9% |
| Interquartile 75% (IQ3) | 93.0% | 73.9% |
| Interquartile Range (IQR) | 16.9% | 5.9% |
| Standard Deviation (Sample) | 13.2% | 8.5% |
| Standard Deviation (Population) | 13.1% | 8.4% |
Similar Demographics by In Labor Force | Age 20-24
Demographics Similar to Celtics by In Labor Force | Age 20-24
In terms of in labor force | age 20-24, the demographic groups most similar to Celtics are Immigrants from Liberia (77.1%, a difference of 0.020%), European (77.1%, a difference of 0.030%), Chippewa (77.1%, a difference of 0.040%), Hawaiian (77.0%, a difference of 0.060%), and Scotch-Irish (77.0%, a difference of 0.090%).
| Demographics | Rating | Rank | In Labor Force | Age 20-24 |
| Ethiopians | 100.0 /100 | #47 | Exceptional 77.3% |
| Serbians | 100.0 /100 | #48 | Exceptional 77.3% |
| Chinese | 100.0 /100 | #49 | Exceptional 77.3% |
| Malaysians | 100.0 /100 | #50 | Exceptional 77.2% |
| Croatians | 100.0 /100 | #51 | Exceptional 77.2% |
| Indonesians | 100.0 /100 | #52 | Exceptional 77.2% |
| Immigrants | Azores | 100.0 /100 | #53 | Exceptional 77.2% |
| Celtics | 99.9 /100 | #54 | Exceptional 77.1% |
| Immigrants | Liberia | 99.9 /100 | #55 | Exceptional 77.1% |
| Europeans | 99.9 /100 | #56 | Exceptional 77.1% |
| Chippewa | 99.9 /100 | #57 | Exceptional 77.1% |
| Hawaiians | 99.9 /100 | #58 | Exceptional 77.0% |
| Scotch-Irish | 99.9 /100 | #59 | Exceptional 77.0% |
| Kenyans | 99.9 /100 | #60 | Exceptional 77.0% |
| Immigrants | Eritrea | 99.9 /100 | #61 | Exceptional 77.0% |
Demographics Similar to Immigrants from Hong Kong by In Labor Force | Age 20-24
In terms of in labor force | age 20-24, the demographic groups most similar to Immigrants from Hong Kong are Immigrants from Israel (71.6%, a difference of 0.030%), Immigrants from Armenia (71.7%, a difference of 0.090%), Trinidadian and Tobagonian (71.5%, a difference of 0.11%), Immigrants from Taiwan (71.5%, a difference of 0.16%), and Immigrants from Eastern Asia (71.8%, a difference of 0.26%).
| Demographics | Rating | Rank | In Labor Force | Age 20-24 |
| Apache | 0.0 /100 | #311 | Tragic 72.0% |
| Immigrants | Caribbean | 0.0 /100 | #312 | Tragic 71.9% |
| Immigrants | Dominica | 0.0 /100 | #313 | Tragic 71.9% |
| Indians (Asian) | 0.0 /100 | #314 | Tragic 71.9% |
| Immigrants | Iran | 0.0 /100 | #315 | Tragic 71.8% |
| Immigrants | Eastern Asia | 0.0 /100 | #316 | Tragic 71.8% |
| Immigrants | Armenia | 0.0 /100 | #317 | Tragic 71.7% |
| Immigrants | Hong Kong | 0.0 /100 | #318 | Tragic 71.6% |
| Immigrants | Israel | 0.0 /100 | #319 | Tragic 71.6% |
| Trinidadians and Tobagonians | 0.0 /100 | #320 | Tragic 71.5% |
| Immigrants | Taiwan | 0.0 /100 | #321 | Tragic 71.5% |
| Filipinos | 0.0 /100 | #322 | Tragic 71.4% |
| West Indians | 0.0 /100 | #323 | Tragic 71.3% |
| Immigrants | Dominican Republic | 0.0 /100 | #324 | Tragic 71.2% |
| Barbadians | 0.0 /100 | #325 | Tragic 71.1% |