Celtic vs Immigrants from Barbados In Labor Force | Age 20-24
COMPARE
Celtic
Immigrants from Barbados
In Labor Force | Age 20-24
In Labor Force | Age 20-24 Comparison
Celtics
Immigrants from Barbados
77.1%
IN LABOR FORCE | AGE 20-24
99.9/ 100
METRIC RATING
54th/ 347
METRIC RANK
69.7%
IN LABOR FORCE | AGE 20-24
0.0/ 100
METRIC RATING
335th/ 347
METRIC RANK
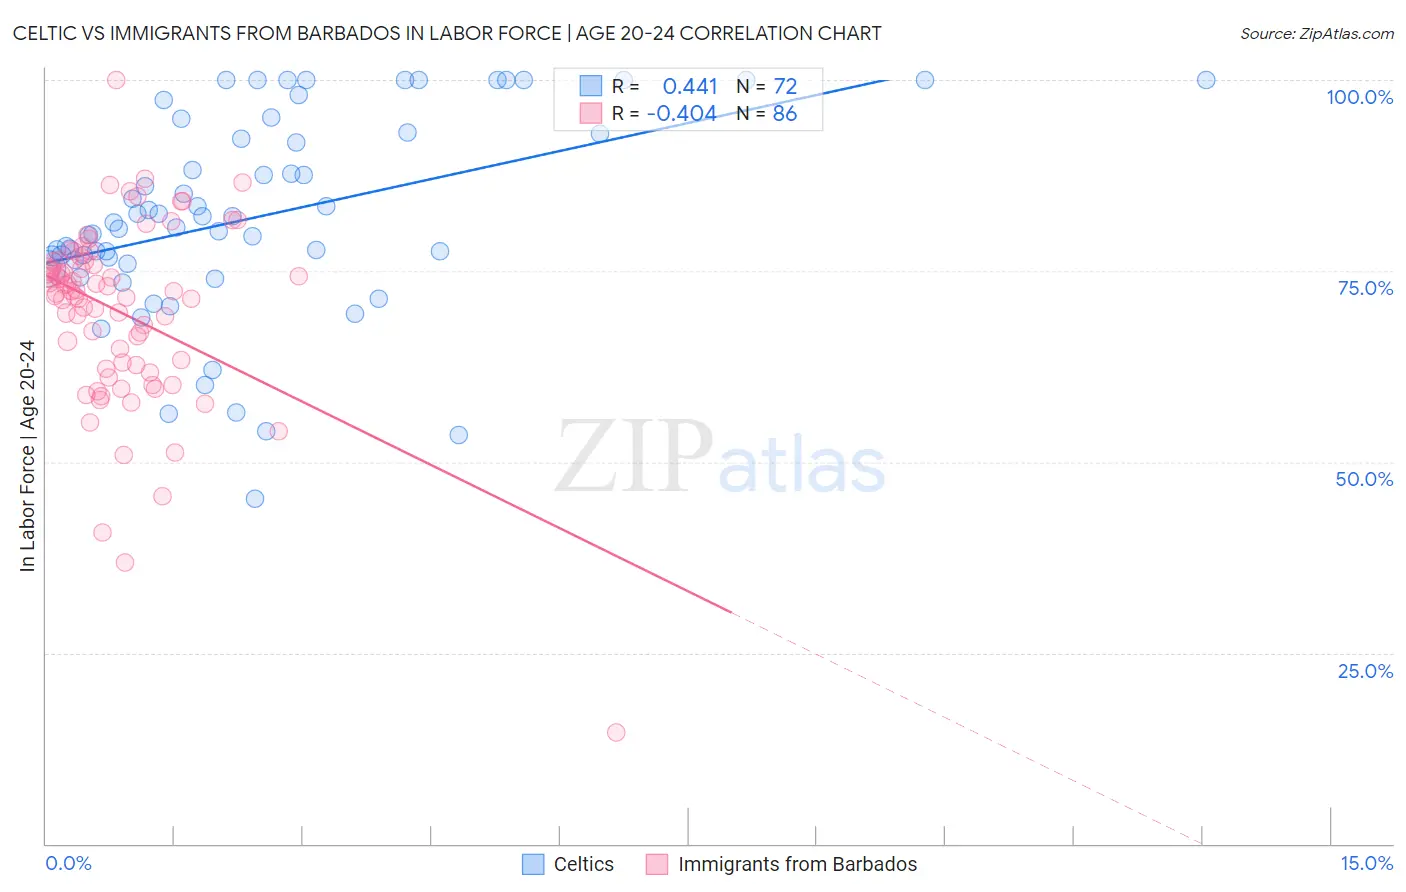
Celtic vs Immigrants from Barbados In Labor Force | Age 20-24 Correlation Chart
The statistical analysis conducted on geographies consisting of 168,822,890 people shows a moderate positive correlation between the proportion of Celtics and labor force participation rate among population between the ages 20 and 24 in the United States with a correlation coefficient (R) of 0.441 and weighted average of 77.1%. Similarly, the statistical analysis conducted on geographies consisting of 112,783,156 people shows a moderate negative correlation between the proportion of Immigrants from Barbados and labor force participation rate among population between the ages 20 and 24 in the United States with a correlation coefficient (R) of -0.404 and weighted average of 69.7%, a difference of 10.6%.
In Labor Force | Age 20-24 Correlation Summary
| Measurement | Celtic | Immigrants from Barbados |
| Minimum | 45.2% | 14.5% |
| Maximum | 100.0% | 100.0% |
| Range | 54.8% | 85.5% |
| Mean | 82.1% | 69.6% |
| Median | 81.0% | 72.1% |
| Interquartile 25% (IQ1) | 76.2% | 62.6% |
| Interquartile 75% (IQ3) | 93.0% | 76.2% |
| Interquartile Range (IQR) | 16.9% | 13.6% |
| Standard Deviation (Sample) | 13.2% | 12.2% |
| Standard Deviation (Population) | 13.1% | 12.1% |
Similar Demographics by In Labor Force | Age 20-24
Demographics Similar to Celtics by In Labor Force | Age 20-24
In terms of in labor force | age 20-24, the demographic groups most similar to Celtics are Immigrants from Liberia (77.1%, a difference of 0.020%), European (77.1%, a difference of 0.030%), Chippewa (77.1%, a difference of 0.040%), Hawaiian (77.0%, a difference of 0.060%), and Scotch-Irish (77.0%, a difference of 0.090%).
| Demographics | Rating | Rank | In Labor Force | Age 20-24 |
| Ethiopians | 100.0 /100 | #47 | Exceptional 77.3% |
| Serbians | 100.0 /100 | #48 | Exceptional 77.3% |
| Chinese | 100.0 /100 | #49 | Exceptional 77.3% |
| Malaysians | 100.0 /100 | #50 | Exceptional 77.2% |
| Croatians | 100.0 /100 | #51 | Exceptional 77.2% |
| Indonesians | 100.0 /100 | #52 | Exceptional 77.2% |
| Immigrants | Azores | 100.0 /100 | #53 | Exceptional 77.2% |
| Celtics | 99.9 /100 | #54 | Exceptional 77.1% |
| Immigrants | Liberia | 99.9 /100 | #55 | Exceptional 77.1% |
| Europeans | 99.9 /100 | #56 | Exceptional 77.1% |
| Chippewa | 99.9 /100 | #57 | Exceptional 77.1% |
| Hawaiians | 99.9 /100 | #58 | Exceptional 77.0% |
| Scotch-Irish | 99.9 /100 | #59 | Exceptional 77.0% |
| Kenyans | 99.9 /100 | #60 | Exceptional 77.0% |
| Immigrants | Eritrea | 99.9 /100 | #61 | Exceptional 77.0% |
Demographics Similar to Immigrants from Barbados by In Labor Force | Age 20-24
In terms of in labor force | age 20-24, the demographic groups most similar to Immigrants from Barbados are British West Indian (70.0%, a difference of 0.35%), Immigrants from Guyana (69.3%, a difference of 0.66%), Yuman (70.3%, a difference of 0.75%), Guyanese (69.2%, a difference of 0.79%), and Immigrants from Uzbekistan (70.4%, a difference of 0.98%).
| Demographics | Rating | Rank | In Labor Force | Age 20-24 |
| Immigrants | China | 0.0 /100 | #328 | Tragic 71.1% |
| Yup'ik | 0.0 /100 | #329 | Tragic 70.9% |
| Vietnamese | 0.0 /100 | #330 | Tragic 70.6% |
| Immigrants | Bangladesh | 0.0 /100 | #331 | Tragic 70.6% |
| Immigrants | Uzbekistan | 0.0 /100 | #332 | Tragic 70.4% |
| Yuman | 0.0 /100 | #333 | Tragic 70.3% |
| British West Indians | 0.0 /100 | #334 | Tragic 70.0% |
| Immigrants | Barbados | 0.0 /100 | #335 | Tragic 69.7% |
| Immigrants | Guyana | 0.0 /100 | #336 | Tragic 69.3% |
| Guyanese | 0.0 /100 | #337 | Tragic 69.2% |
| Pima | 0.0 /100 | #338 | Tragic 69.0% |
| Immigrants | Yemen | 0.0 /100 | #339 | Tragic 68.9% |
| Menominee | 0.0 /100 | #340 | Tragic 68.7% |
| Tohono O'odham | 0.0 /100 | #341 | Tragic 68.6% |
| Immigrants | St. Vincent and the Grenadines | 0.0 /100 | #342 | Tragic 68.4% |