Austrian vs Czechoslovakian In Labor Force | Age 20-64
COMPARE
Austrian
Czechoslovakian
In Labor Force | Age 20-64
In Labor Force | Age 20-64 Comparison
Austrians
Czechoslovakians
79.7%
IN LABOR FORCE | AGE 20-64
67.6/ 100
METRIC RATING
158th/ 347
METRIC RANK
79.5%
IN LABOR FORCE | AGE 20-64
44.3/ 100
METRIC RATING
178th/ 347
METRIC RANK
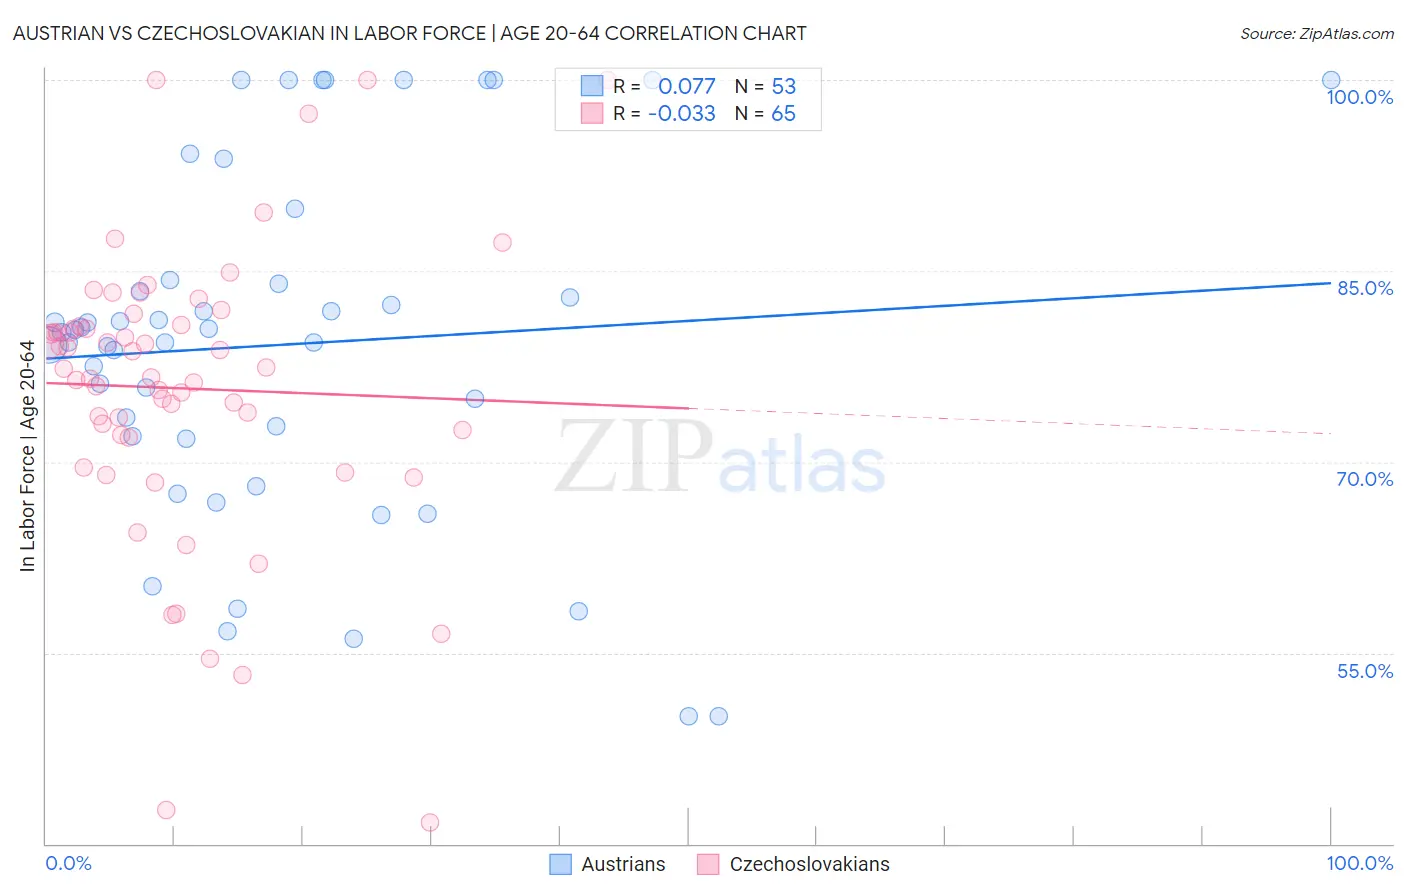
Austrian vs Czechoslovakian In Labor Force | Age 20-64 Correlation Chart
The statistical analysis conducted on geographies consisting of 452,086,784 people shows a slight positive correlation between the proportion of Austrians and labor force participation rate among population between the ages 20 and 64 in the United States with a correlation coefficient (R) of 0.077 and weighted average of 79.7%. Similarly, the statistical analysis conducted on geographies consisting of 368,672,704 people shows no correlation between the proportion of Czechoslovakians and labor force participation rate among population between the ages 20 and 64 in the United States with a correlation coefficient (R) of -0.033 and weighted average of 79.5%, a difference of 0.19%.
In Labor Force | Age 20-64 Correlation Summary
| Measurement | Austrian | Czechoslovakian |
| Minimum | 50.0% | 41.7% |
| Maximum | 100.0% | 100.0% |
| Range | 50.0% | 58.3% |
| Mean | 79.2% | 75.8% |
| Median | 80.2% | 77.3% |
| Interquartile 25% (IQ1) | 71.9% | 72.0% |
| Interquartile 75% (IQ3) | 84.2% | 80.7% |
| Interquartile Range (IQR) | 12.3% | 8.7% |
| Standard Deviation (Sample) | 13.5% | 11.4% |
| Standard Deviation (Population) | 13.4% | 11.3% |
Demographics Similar to Austrians and Czechoslovakians by In Labor Force | Age 20-64
In terms of in labor force | age 20-64, the demographic groups most similar to Austrians are Immigrants from Cuba (79.7%, a difference of 0.010%), Moroccan (79.7%, a difference of 0.010%), South African (79.7%, a difference of 0.010%), German (79.7%, a difference of 0.020%), and Immigrants from Costa Rica (79.7%, a difference of 0.030%). Similarly, the demographic groups most similar to Czechoslovakians are Cuban (79.5%, a difference of 0.010%), Australian (79.5%, a difference of 0.010%), Immigrants from Netherlands (79.5%, a difference of 0.010%), Syrian (79.6%, a difference of 0.050%), and Immigrants from Switzerland (79.6%, a difference of 0.070%).
| Demographics | Rating | Rank | In Labor Force | Age 20-64 |
| Austrians | 67.6 /100 | #158 | Good 79.7% |
| Immigrants | Cuba | 66.7 /100 | #159 | Good 79.7% |
| Moroccans | 66.7 /100 | #160 | Good 79.7% |
| South Africans | 66.2 /100 | #161 | Good 79.7% |
| Germans | 65.2 /100 | #162 | Good 79.7% |
| Immigrants | Costa Rica | 64.6 /100 | #163 | Good 79.7% |
| Immigrants | Burma/Myanmar | 64.4 /100 | #164 | Good 79.7% |
| Nigerians | 64.0 /100 | #165 | Good 79.7% |
| Okinawans | 62.7 /100 | #166 | Good 79.6% |
| Immigrants | Iraq | 62.0 /100 | #167 | Good 79.6% |
| Immigrants | Indonesia | 61.8 /100 | #168 | Good 79.6% |
| Laotians | 58.4 /100 | #169 | Average 79.6% |
| Slavs | 54.0 /100 | #170 | Average 79.6% |
| Immigrants | Switzerland | 53.3 /100 | #171 | Average 79.6% |
| Immigrants | Belgium | 53.1 /100 | #172 | Average 79.6% |
| Immigrants | Scotland | 52.4 /100 | #173 | Average 79.6% |
| Syrians | 50.0 /100 | #174 | Average 79.6% |
| Cubans | 46.1 /100 | #175 | Average 79.5% |
| Australians | 46.0 /100 | #176 | Average 79.5% |
| Immigrants | Netherlands | 45.2 /100 | #177 | Average 79.5% |
| Czechoslovakians | 44.3 /100 | #178 | Average 79.5% |