Palestinian vs Czechoslovakian In Labor Force | Age 20-64
COMPARE
Palestinian
Czechoslovakian
In Labor Force | Age 20-64
In Labor Force | Age 20-64 Comparison
Palestinians
Czechoslovakians
80.0%
IN LABOR FORCE | AGE 20-64
95.5/ 100
METRIC RATING
101st/ 347
METRIC RANK
79.5%
IN LABOR FORCE | AGE 20-64
44.3/ 100
METRIC RATING
178th/ 347
METRIC RANK
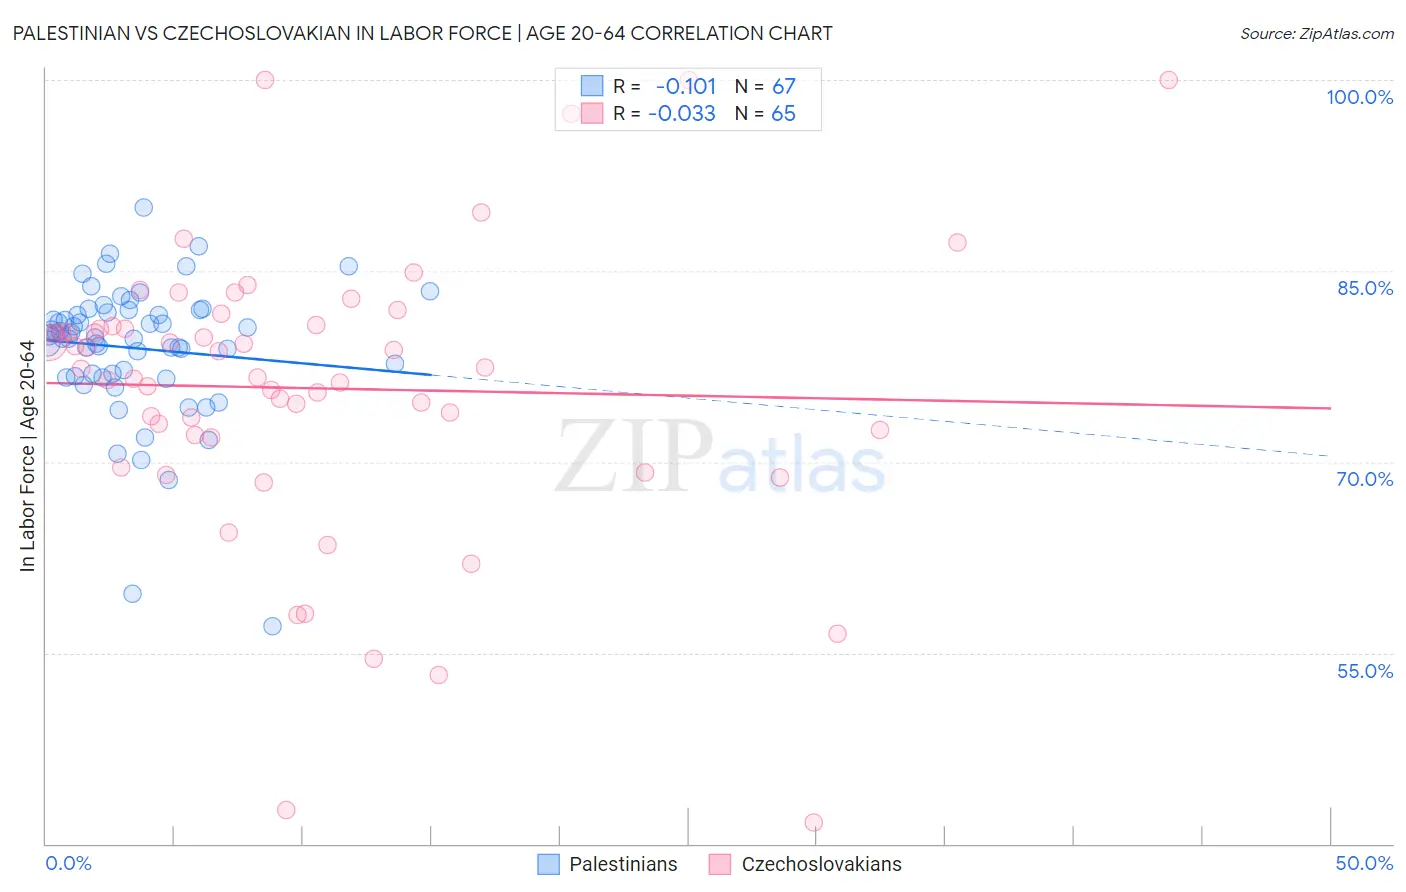
Palestinian vs Czechoslovakian In Labor Force | Age 20-64 Correlation Chart
The statistical analysis conducted on geographies consisting of 216,468,318 people shows a poor negative correlation between the proportion of Palestinians and labor force participation rate among population between the ages 20 and 64 in the United States with a correlation coefficient (R) of -0.101 and weighted average of 80.0%. Similarly, the statistical analysis conducted on geographies consisting of 368,672,704 people shows no correlation between the proportion of Czechoslovakians and labor force participation rate among population between the ages 20 and 64 in the United States with a correlation coefficient (R) of -0.033 and weighted average of 79.5%, a difference of 0.66%.
In Labor Force | Age 20-64 Correlation Summary
| Measurement | Palestinian | Czechoslovakian |
| Minimum | 57.1% | 41.7% |
| Maximum | 90.0% | 100.0% |
| Range | 32.9% | 58.3% |
| Mean | 78.9% | 75.8% |
| Median | 79.8% | 77.3% |
| Interquartile 25% (IQ1) | 76.7% | 72.0% |
| Interquartile 75% (IQ3) | 81.9% | 80.7% |
| Interquartile Range (IQR) | 5.2% | 8.7% |
| Standard Deviation (Sample) | 5.4% | 11.4% |
| Standard Deviation (Population) | 5.4% | 11.3% |
Similar Demographics by In Labor Force | Age 20-64
Demographics Similar to Palestinians by In Labor Force | Age 20-64
In terms of in labor force | age 20-64, the demographic groups most similar to Palestinians are Filipino (80.1%, a difference of 0.0%), Immigrants from Australia (80.0%, a difference of 0.0%), Russian (80.0%, a difference of 0.0%), Immigrants from Chile (80.1%, a difference of 0.010%), and Venezuelan (80.0%, a difference of 0.010%).
| Demographics | Rating | Rank | In Labor Force | Age 20-64 |
| Immigrants | Asia | 96.0 /100 | #94 | Exceptional 80.1% |
| Yugoslavians | 95.9 /100 | #95 | Exceptional 80.1% |
| Immigrants | Malaysia | 95.9 /100 | #96 | Exceptional 80.1% |
| South Americans | 95.9 /100 | #97 | Exceptional 80.1% |
| Immigrants | Uruguay | 95.8 /100 | #98 | Exceptional 80.1% |
| Immigrants | Chile | 95.7 /100 | #99 | Exceptional 80.1% |
| Filipinos | 95.6 /100 | #100 | Exceptional 80.1% |
| Palestinians | 95.5 /100 | #101 | Exceptional 80.0% |
| Immigrants | Australia | 95.5 /100 | #102 | Exceptional 80.0% |
| Russians | 95.5 /100 | #103 | Exceptional 80.0% |
| Venezuelans | 95.3 /100 | #104 | Exceptional 80.0% |
| Immigrants | Ghana | 95.0 /100 | #105 | Exceptional 80.0% |
| Greeks | 94.8 /100 | #106 | Exceptional 80.0% |
| Immigrants | Jordan | 94.8 /100 | #107 | Exceptional 80.0% |
| Iranians | 94.3 /100 | #108 | Exceptional 80.0% |
Demographics Similar to Czechoslovakians by In Labor Force | Age 20-64
In terms of in labor force | age 20-64, the demographic groups most similar to Czechoslovakians are Cuban (79.5%, a difference of 0.010%), Australian (79.5%, a difference of 0.010%), Immigrants from Netherlands (79.5%, a difference of 0.010%), Armenian (79.5%, a difference of 0.020%), and Salvadoran (79.5%, a difference of 0.030%).
| Demographics | Rating | Rank | In Labor Force | Age 20-64 |
| Immigrants | Switzerland | 53.3 /100 | #171 | Average 79.6% |
| Immigrants | Belgium | 53.1 /100 | #172 | Average 79.6% |
| Immigrants | Scotland | 52.4 /100 | #173 | Average 79.6% |
| Syrians | 50.0 /100 | #174 | Average 79.6% |
| Cubans | 46.1 /100 | #175 | Average 79.5% |
| Australians | 46.0 /100 | #176 | Average 79.5% |
| Immigrants | Netherlands | 45.2 /100 | #177 | Average 79.5% |
| Czechoslovakians | 44.3 /100 | #178 | Average 79.5% |
| Armenians | 41.4 /100 | #179 | Average 79.5% |
| Salvadorans | 41.0 /100 | #180 | Average 79.5% |
| Immigrants | Saudi Arabia | 37.7 /100 | #181 | Fair 79.5% |
| Malaysians | 37.1 /100 | #182 | Fair 79.5% |
| Immigrants | Hungary | 36.8 /100 | #183 | Fair 79.5% |
| Finns | 35.9 /100 | #184 | Fair 79.5% |
| Israelis | 34.7 /100 | #185 | Fair 79.5% |