Austrian vs Bermudan In Labor Force | Age 20-64
COMPARE
Austrian
Bermudan
In Labor Force | Age 20-64
In Labor Force | Age 20-64 Comparison
Austrians
Bermudans
79.7%
IN LABOR FORCE | AGE 20-64
67.6/ 100
METRIC RATING
158th/ 347
METRIC RANK
80.0%
IN LABOR FORCE | AGE 20-64
93.3/ 100
METRIC RATING
115th/ 347
METRIC RANK
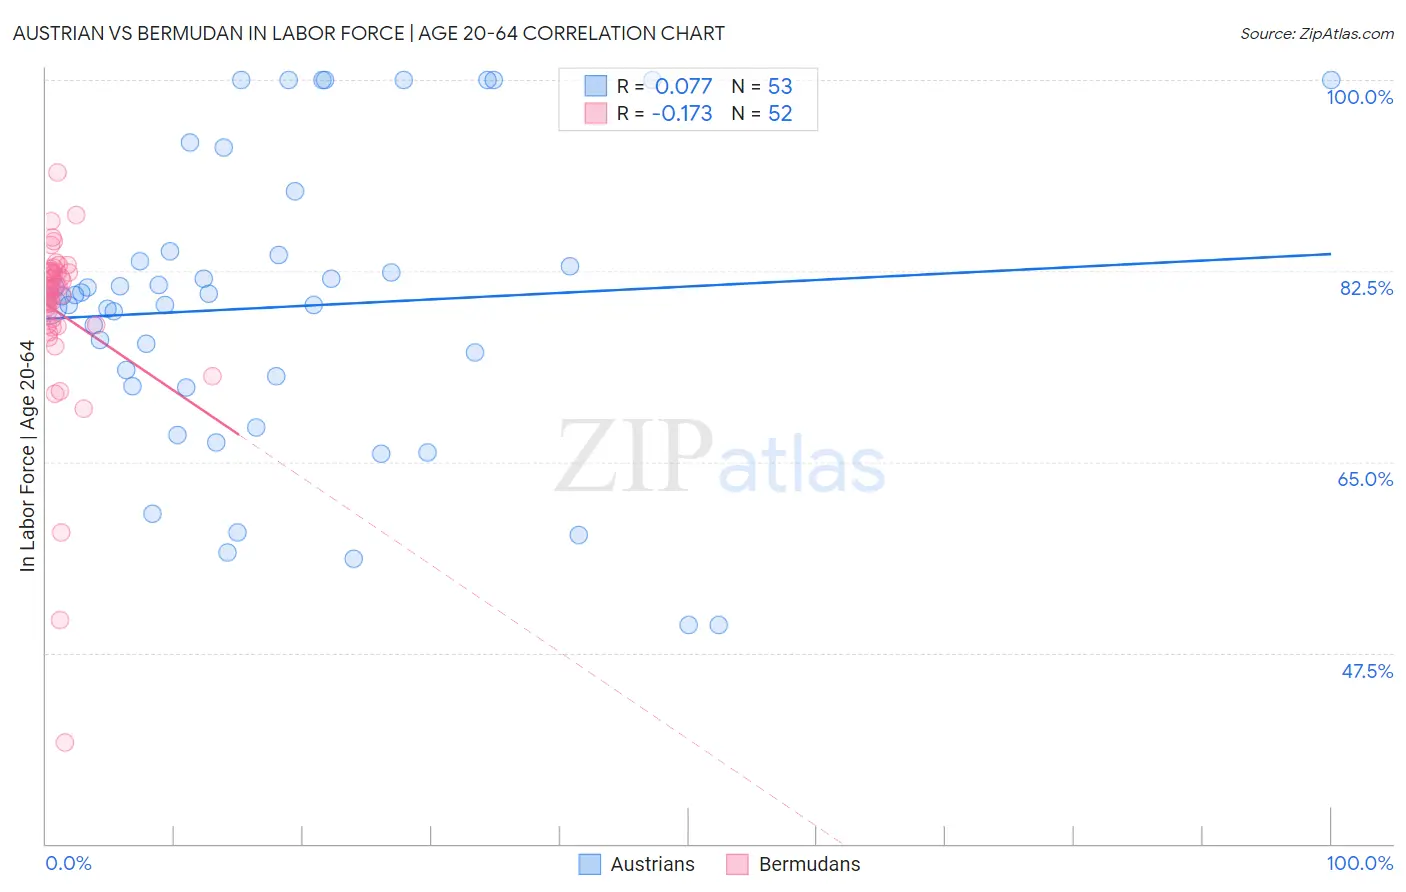
Austrian vs Bermudan In Labor Force | Age 20-64 Correlation Chart
The statistical analysis conducted on geographies consisting of 452,086,784 people shows a slight positive correlation between the proportion of Austrians and labor force participation rate among population between the ages 20 and 64 in the United States with a correlation coefficient (R) of 0.077 and weighted average of 79.7%. Similarly, the statistical analysis conducted on geographies consisting of 55,730,379 people shows a poor negative correlation between the proportion of Bermudans and labor force participation rate among population between the ages 20 and 64 in the United States with a correlation coefficient (R) of -0.173 and weighted average of 80.0%, a difference of 0.38%.
In Labor Force | Age 20-64 Correlation Summary
| Measurement | Austrian | Bermudan |
| Minimum | 50.0% | 39.3% |
| Maximum | 100.0% | 91.5% |
| Range | 50.0% | 52.2% |
| Mean | 79.2% | 78.7% |
| Median | 80.2% | 80.7% |
| Interquartile 25% (IQ1) | 71.9% | 77.5% |
| Interquartile 75% (IQ3) | 84.2% | 82.4% |
| Interquartile Range (IQR) | 12.3% | 4.9% |
| Standard Deviation (Sample) | 13.5% | 8.5% |
| Standard Deviation (Population) | 13.4% | 8.4% |
Similar Demographics by In Labor Force | Age 20-64
Demographics Similar to Austrians by In Labor Force | Age 20-64
In terms of in labor force | age 20-64, the demographic groups most similar to Austrians are Immigrants from South Africa (79.7%, a difference of 0.010%), Senegalese (79.7%, a difference of 0.010%), Immigrants from China (79.7%, a difference of 0.010%), Immigrants from Cuba (79.7%, a difference of 0.010%), and Moroccan (79.7%, a difference of 0.010%).
| Demographics | Rating | Rank | In Labor Force | Age 20-64 |
| Scandinavians | 72.0 /100 | #151 | Good 79.7% |
| Immigrants | Northern Europe | 72.0 /100 | #152 | Good 79.7% |
| Immigrants | Kazakhstan | 69.5 /100 | #153 | Good 79.7% |
| New Zealanders | 69.4 /100 | #154 | Good 79.7% |
| Immigrants | South Africa | 69.2 /100 | #155 | Good 79.7% |
| Senegalese | 69.1 /100 | #156 | Good 79.7% |
| Immigrants | China | 69.1 /100 | #157 | Good 79.7% |
| Austrians | 67.6 /100 | #158 | Good 79.7% |
| Immigrants | Cuba | 66.7 /100 | #159 | Good 79.7% |
| Moroccans | 66.7 /100 | #160 | Good 79.7% |
| South Africans | 66.2 /100 | #161 | Good 79.7% |
| Germans | 65.2 /100 | #162 | Good 79.7% |
| Immigrants | Costa Rica | 64.6 /100 | #163 | Good 79.7% |
| Immigrants | Burma/Myanmar | 64.4 /100 | #164 | Good 79.7% |
| Nigerians | 64.0 /100 | #165 | Good 79.7% |
Demographics Similar to Bermudans by In Labor Force | Age 20-64
In terms of in labor force | age 20-64, the demographic groups most similar to Bermudans are Immigrants from Western Africa (80.0%, a difference of 0.010%), Estonian (80.0%, a difference of 0.020%), Immigrants from South America (80.0%, a difference of 0.020%), Immigrants from Italy (80.0%, a difference of 0.020%), and Sri Lankan (80.0%, a difference of 0.020%).
| Demographics | Rating | Rank | In Labor Force | Age 20-64 |
| Iranians | 94.3 /100 | #108 | Exceptional 80.0% |
| Immigrants | Argentina | 94.1 /100 | #109 | Exceptional 80.0% |
| Estonians | 94.0 /100 | #110 | Exceptional 80.0% |
| Immigrants | South America | 93.9 /100 | #111 | Exceptional 80.0% |
| Immigrants | Italy | 93.9 /100 | #112 | Exceptional 80.0% |
| Sri Lankans | 93.9 /100 | #113 | Exceptional 80.0% |
| Argentineans | 93.8 /100 | #114 | Exceptional 80.0% |
| Bermudans | 93.3 /100 | #115 | Exceptional 80.0% |
| Immigrants | Western Africa | 93.1 /100 | #116 | Exceptional 80.0% |
| Immigrants | Vietnam | 92.7 /100 | #117 | Exceptional 80.0% |
| Cape Verdeans | 92.7 /100 | #118 | Exceptional 80.0% |
| Immigrants | Taiwan | 92.5 /100 | #119 | Exceptional 80.0% |
| Maltese | 92.4 /100 | #120 | Exceptional 80.0% |
| Immigrants | Kuwait | 92.2 /100 | #121 | Exceptional 80.0% |
| Mongolians | 92.0 /100 | #122 | Exceptional 79.9% |