Pueblo vs Czechoslovakian In Labor Force | Age 20-64
COMPARE
Pueblo
Czechoslovakian
In Labor Force | Age 20-64
In Labor Force | Age 20-64 Comparison
Pueblo
Czechoslovakians
72.6%
IN LABOR FORCE | AGE 20-64
0.0/ 100
METRIC RATING
340th/ 347
METRIC RANK
79.5%
IN LABOR FORCE | AGE 20-64
44.3/ 100
METRIC RATING
178th/ 347
METRIC RANK
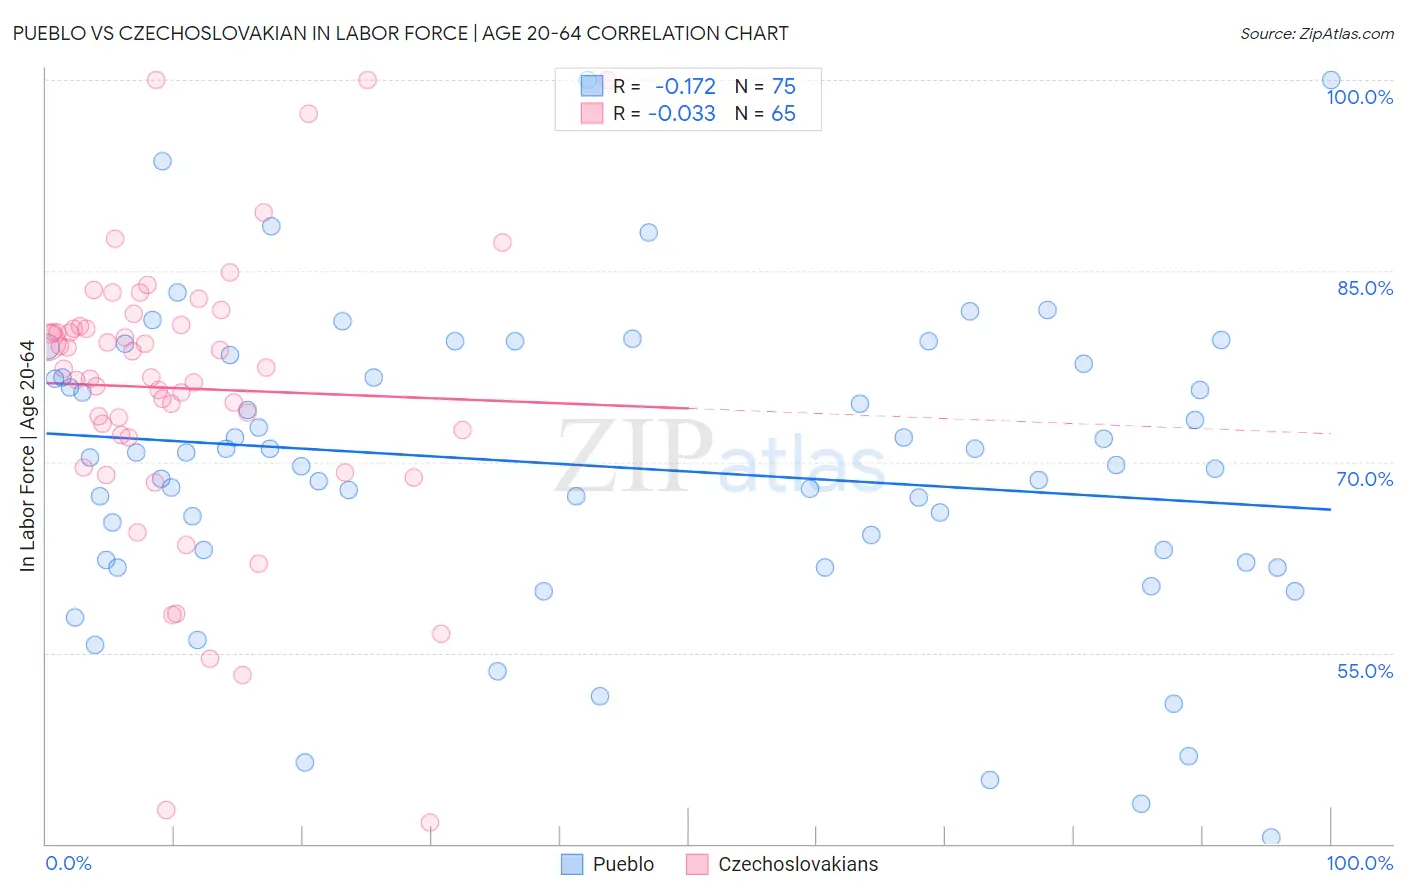
Pueblo vs Czechoslovakian In Labor Force | Age 20-64 Correlation Chart
The statistical analysis conducted on geographies consisting of 120,084,084 people shows a poor negative correlation between the proportion of Pueblo and labor force participation rate among population between the ages 20 and 64 in the United States with a correlation coefficient (R) of -0.172 and weighted average of 72.6%. Similarly, the statistical analysis conducted on geographies consisting of 368,672,704 people shows no correlation between the proportion of Czechoslovakians and labor force participation rate among population between the ages 20 and 64 in the United States with a correlation coefficient (R) of -0.033 and weighted average of 79.5%, a difference of 9.5%.
In Labor Force | Age 20-64 Correlation Summary
| Measurement | Pueblo | Czechoslovakian |
| Minimum | 40.5% | 41.7% |
| Maximum | 100.0% | 100.0% |
| Range | 59.5% | 58.3% |
| Mean | 69.7% | 75.8% |
| Median | 70.3% | 77.3% |
| Interquartile 25% (IQ1) | 62.3% | 72.0% |
| Interquartile 75% (IQ3) | 77.7% | 80.7% |
| Interquartile Range (IQR) | 15.4% | 8.7% |
| Standard Deviation (Sample) | 11.9% | 11.4% |
| Standard Deviation (Population) | 11.8% | 11.3% |
Similar Demographics by In Labor Force | Age 20-64
Demographics Similar to Pueblo by In Labor Force | Age 20-64
In terms of in labor force | age 20-64, the demographic groups most similar to Pueblo are Houma (72.7%, a difference of 0.15%), Immigrants from Yemen (72.3%, a difference of 0.48%), Puerto Rican (73.1%, a difference of 0.59%), Yup'ik (73.2%, a difference of 0.80%), and Crow (73.3%, a difference of 0.92%).
| Demographics | Rating | Rank | In Labor Force | Age 20-64 |
| Natives/Alaskans | 0.0 /100 | #333 | Tragic 73.9% |
| Apache | 0.0 /100 | #334 | Tragic 73.7% |
| Ute | 0.0 /100 | #335 | Tragic 73.7% |
| Crow | 0.0 /100 | #336 | Tragic 73.3% |
| Yup'ik | 0.0 /100 | #337 | Tragic 73.2% |
| Puerto Ricans | 0.0 /100 | #338 | Tragic 73.1% |
| Houma | 0.0 /100 | #339 | Tragic 72.7% |
| Pueblo | 0.0 /100 | #340 | Tragic 72.6% |
| Immigrants | Yemen | 0.0 /100 | #341 | Tragic 72.3% |
| Yuman | 0.0 /100 | #342 | Tragic 71.7% |
| Hopi | 0.0 /100 | #343 | Tragic 71.7% |
| Lumbee | 0.0 /100 | #344 | Tragic 70.6% |
| Tohono O'odham | 0.0 /100 | #345 | Tragic 70.4% |
| Navajo | 0.0 /100 | #346 | Tragic 69.2% |
| Pima | 0.0 /100 | #347 | Tragic 69.0% |
Demographics Similar to Czechoslovakians by In Labor Force | Age 20-64
In terms of in labor force | age 20-64, the demographic groups most similar to Czechoslovakians are Cuban (79.5%, a difference of 0.010%), Australian (79.5%, a difference of 0.010%), Immigrants from Netherlands (79.5%, a difference of 0.010%), Armenian (79.5%, a difference of 0.020%), and Salvadoran (79.5%, a difference of 0.030%).
| Demographics | Rating | Rank | In Labor Force | Age 20-64 |
| Immigrants | Switzerland | 53.3 /100 | #171 | Average 79.6% |
| Immigrants | Belgium | 53.1 /100 | #172 | Average 79.6% |
| Immigrants | Scotland | 52.4 /100 | #173 | Average 79.6% |
| Syrians | 50.0 /100 | #174 | Average 79.6% |
| Cubans | 46.1 /100 | #175 | Average 79.5% |
| Australians | 46.0 /100 | #176 | Average 79.5% |
| Immigrants | Netherlands | 45.2 /100 | #177 | Average 79.5% |
| Czechoslovakians | 44.3 /100 | #178 | Average 79.5% |
| Armenians | 41.4 /100 | #179 | Average 79.5% |
| Salvadorans | 41.0 /100 | #180 | Average 79.5% |
| Immigrants | Saudi Arabia | 37.7 /100 | #181 | Fair 79.5% |
| Malaysians | 37.1 /100 | #182 | Fair 79.5% |
| Immigrants | Hungary | 36.8 /100 | #183 | Fair 79.5% |
| Finns | 35.9 /100 | #184 | Fair 79.5% |
| Israelis | 34.7 /100 | #185 | Fair 79.5% |