Austrian vs Cherokee In Labor Force | Age 20-64
COMPARE
Austrian
Cherokee
In Labor Force | Age 20-64
In Labor Force | Age 20-64 Comparison
Austrians
Cherokee
79.7%
IN LABOR FORCE | AGE 20-64
67.6/ 100
METRIC RATING
158th/ 347
METRIC RANK
76.2%
IN LABOR FORCE | AGE 20-64
0.0/ 100
METRIC RATING
317th/ 347
METRIC RANK
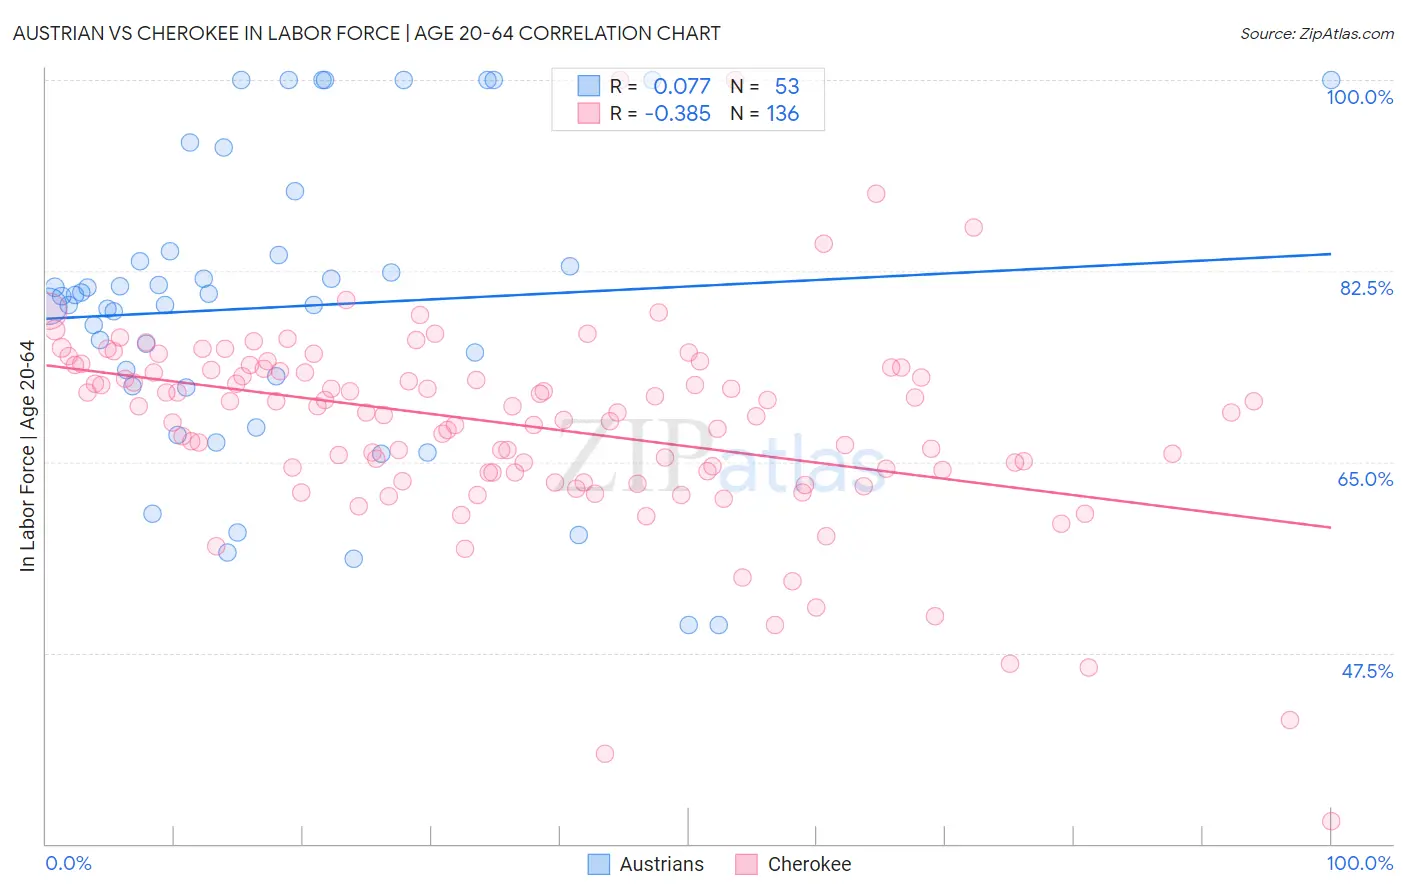
Austrian vs Cherokee In Labor Force | Age 20-64 Correlation Chart
The statistical analysis conducted on geographies consisting of 452,086,784 people shows a slight positive correlation between the proportion of Austrians and labor force participation rate among population between the ages 20 and 64 in the United States with a correlation coefficient (R) of 0.077 and weighted average of 79.7%. Similarly, the statistical analysis conducted on geographies consisting of 493,680,494 people shows a mild negative correlation between the proportion of Cherokee and labor force participation rate among population between the ages 20 and 64 in the United States with a correlation coefficient (R) of -0.385 and weighted average of 76.2%, a difference of 4.5%.
In Labor Force | Age 20-64 Correlation Summary
| Measurement | Austrian | Cherokee |
| Minimum | 50.0% | 32.1% |
| Maximum | 100.0% | 100.0% |
| Range | 50.0% | 67.9% |
| Mean | 79.2% | 68.4% |
| Median | 80.2% | 69.6% |
| Interquartile 25% (IQ1) | 71.9% | 64.0% |
| Interquartile 75% (IQ3) | 84.2% | 73.5% |
| Interquartile Range (IQR) | 12.3% | 9.5% |
| Standard Deviation (Sample) | 13.5% | 9.3% |
| Standard Deviation (Population) | 13.4% | 9.3% |
Similar Demographics by In Labor Force | Age 20-64
Demographics Similar to Austrians by In Labor Force | Age 20-64
In terms of in labor force | age 20-64, the demographic groups most similar to Austrians are Immigrants from South Africa (79.7%, a difference of 0.010%), Senegalese (79.7%, a difference of 0.010%), Immigrants from China (79.7%, a difference of 0.010%), Immigrants from Cuba (79.7%, a difference of 0.010%), and Moroccan (79.7%, a difference of 0.010%).
| Demographics | Rating | Rank | In Labor Force | Age 20-64 |
| Scandinavians | 72.0 /100 | #151 | Good 79.7% |
| Immigrants | Northern Europe | 72.0 /100 | #152 | Good 79.7% |
| Immigrants | Kazakhstan | 69.5 /100 | #153 | Good 79.7% |
| New Zealanders | 69.4 /100 | #154 | Good 79.7% |
| Immigrants | South Africa | 69.2 /100 | #155 | Good 79.7% |
| Senegalese | 69.1 /100 | #156 | Good 79.7% |
| Immigrants | China | 69.1 /100 | #157 | Good 79.7% |
| Austrians | 67.6 /100 | #158 | Good 79.7% |
| Immigrants | Cuba | 66.7 /100 | #159 | Good 79.7% |
| Moroccans | 66.7 /100 | #160 | Good 79.7% |
| South Africans | 66.2 /100 | #161 | Good 79.7% |
| Germans | 65.2 /100 | #162 | Good 79.7% |
| Immigrants | Costa Rica | 64.6 /100 | #163 | Good 79.7% |
| Immigrants | Burma/Myanmar | 64.4 /100 | #164 | Good 79.7% |
| Nigerians | 64.0 /100 | #165 | Good 79.7% |
Demographics Similar to Cherokee by In Labor Force | Age 20-64
In terms of in labor force | age 20-64, the demographic groups most similar to Cherokee are Chickasaw (76.2%, a difference of 0.040%), Inupiat (76.1%, a difference of 0.21%), Yaqui (76.5%, a difference of 0.40%), Ottawa (76.7%, a difference of 0.59%), and Yakama (75.8%, a difference of 0.59%).
| Demographics | Rating | Rank | In Labor Force | Age 20-64 |
| Comanche | 0.0 /100 | #310 | Tragic 77.0% |
| Blackfeet | 0.0 /100 | #311 | Tragic 77.0% |
| Alaskan Athabascans | 0.0 /100 | #312 | Tragic 76.9% |
| Shoshone | 0.0 /100 | #313 | Tragic 76.8% |
| Blacks/African Americans | 0.0 /100 | #314 | Tragic 76.8% |
| Ottawa | 0.0 /100 | #315 | Tragic 76.7% |
| Yaqui | 0.0 /100 | #316 | Tragic 76.5% |
| Cherokee | 0.0 /100 | #317 | Tragic 76.2% |
| Chickasaw | 0.0 /100 | #318 | Tragic 76.2% |
| Inupiat | 0.0 /100 | #319 | Tragic 76.1% |
| Yakama | 0.0 /100 | #320 | Tragic 75.8% |
| Seminole | 0.0 /100 | #321 | Tragic 75.5% |
| Dutch West Indians | 0.0 /100 | #322 | Tragic 75.5% |
| Cajuns | 0.0 /100 | #323 | Tragic 75.5% |
| Choctaw | 0.0 /100 | #324 | Tragic 75.4% |