Tlingit-Haida vs Czechoslovakian In Labor Force | Age 20-64
COMPARE
Tlingit-Haida
Czechoslovakian
In Labor Force | Age 20-64
In Labor Force | Age 20-64 Comparison
Tlingit-Haida
Czechoslovakians
79.0%
IN LABOR FORCE | AGE 20-64
3.2/ 100
METRIC RATING
235th/ 347
METRIC RANK
79.5%
IN LABOR FORCE | AGE 20-64
44.3/ 100
METRIC RATING
178th/ 347
METRIC RANK
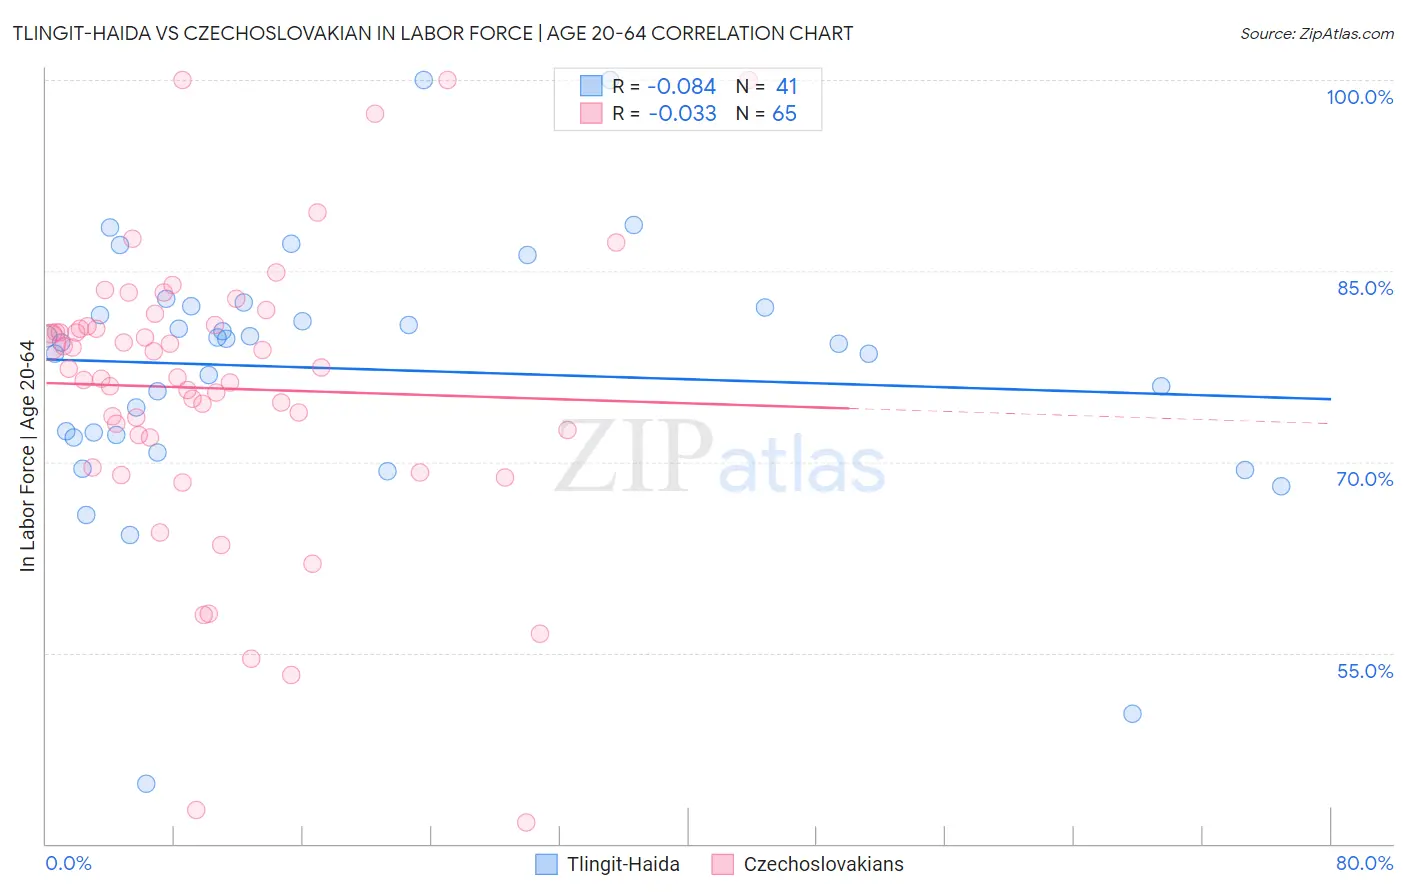
Tlingit-Haida vs Czechoslovakian In Labor Force | Age 20-64 Correlation Chart
The statistical analysis conducted on geographies consisting of 60,871,082 people shows a slight negative correlation between the proportion of Tlingit-Haida and labor force participation rate among population between the ages 20 and 64 in the United States with a correlation coefficient (R) of -0.084 and weighted average of 79.0%. Similarly, the statistical analysis conducted on geographies consisting of 368,672,704 people shows no correlation between the proportion of Czechoslovakians and labor force participation rate among population between the ages 20 and 64 in the United States with a correlation coefficient (R) of -0.033 and weighted average of 79.5%, a difference of 0.64%.
In Labor Force | Age 20-64 Correlation Summary
| Measurement | Tlingit-Haida | Czechoslovakian |
| Minimum | 44.7% | 41.7% |
| Maximum | 100.0% | 100.0% |
| Range | 55.3% | 58.3% |
| Mean | 77.3% | 75.8% |
| Median | 79.4% | 77.3% |
| Interquartile 25% (IQ1) | 72.0% | 72.0% |
| Interquartile 75% (IQ3) | 82.1% | 80.7% |
| Interquartile Range (IQR) | 10.1% | 8.7% |
| Standard Deviation (Sample) | 10.4% | 11.4% |
| Standard Deviation (Population) | 10.2% | 11.3% |
Similar Demographics by In Labor Force | Age 20-64
Demographics Similar to Tlingit-Haida by In Labor Force | Age 20-64
In terms of in labor force | age 20-64, the demographic groups most similar to Tlingit-Haida are Immigrants from Canada (79.0%, a difference of 0.0%), Samoan (79.0%, a difference of 0.020%), Immigrants from North America (79.0%, a difference of 0.020%), Immigrants from Jamaica (79.0%, a difference of 0.040%), and Japanese (79.1%, a difference of 0.050%).
| Demographics | Rating | Rank | In Labor Force | Age 20-64 |
| Panamanians | 5.7 /100 | #228 | Tragic 79.1% |
| Alsatians | 5.7 /100 | #229 | Tragic 79.1% |
| Native Hawaiians | 5.6 /100 | #230 | Tragic 79.1% |
| Lebanese | 5.1 /100 | #231 | Tragic 79.1% |
| Guamanians/Chamorros | 4.5 /100 | #232 | Tragic 79.1% |
| Japanese | 4.0 /100 | #233 | Tragic 79.1% |
| Immigrants | Canada | 3.2 /100 | #234 | Tragic 79.0% |
| Tlingit-Haida | 3.2 /100 | #235 | Tragic 79.0% |
| Samoans | 2.9 /100 | #236 | Tragic 79.0% |
| Immigrants | North America | 2.9 /100 | #237 | Tragic 79.0% |
| Immigrants | Jamaica | 2.6 /100 | #238 | Tragic 79.0% |
| Welsh | 2.4 /100 | #239 | Tragic 79.0% |
| Trinidadians and Tobagonians | 2.3 /100 | #240 | Tragic 79.0% |
| Jamaicans | 2.0 /100 | #241 | Tragic 78.9% |
| Immigrants | Micronesia | 1.9 /100 | #242 | Tragic 78.9% |
Demographics Similar to Czechoslovakians by In Labor Force | Age 20-64
In terms of in labor force | age 20-64, the demographic groups most similar to Czechoslovakians are Cuban (79.5%, a difference of 0.010%), Australian (79.5%, a difference of 0.010%), Immigrants from Netherlands (79.5%, a difference of 0.010%), Armenian (79.5%, a difference of 0.020%), and Salvadoran (79.5%, a difference of 0.030%).
| Demographics | Rating | Rank | In Labor Force | Age 20-64 |
| Immigrants | Switzerland | 53.3 /100 | #171 | Average 79.6% |
| Immigrants | Belgium | 53.1 /100 | #172 | Average 79.6% |
| Immigrants | Scotland | 52.4 /100 | #173 | Average 79.6% |
| Syrians | 50.0 /100 | #174 | Average 79.6% |
| Cubans | 46.1 /100 | #175 | Average 79.5% |
| Australians | 46.0 /100 | #176 | Average 79.5% |
| Immigrants | Netherlands | 45.2 /100 | #177 | Average 79.5% |
| Czechoslovakians | 44.3 /100 | #178 | Average 79.5% |
| Armenians | 41.4 /100 | #179 | Average 79.5% |
| Salvadorans | 41.0 /100 | #180 | Average 79.5% |
| Immigrants | Saudi Arabia | 37.7 /100 | #181 | Fair 79.5% |
| Malaysians | 37.1 /100 | #182 | Fair 79.5% |
| Immigrants | Hungary | 36.8 /100 | #183 | Fair 79.5% |
| Finns | 35.9 /100 | #184 | Fair 79.5% |
| Israelis | 34.7 /100 | #185 | Fair 79.5% |