Austrian vs Indian (Asian) In Labor Force | Age 20-64
COMPARE
Austrian
Indian (Asian)
In Labor Force | Age 20-64
In Labor Force | Age 20-64 Comparison
Austrians
Indians (Asian)
79.7%
IN LABOR FORCE | AGE 20-64
67.6/ 100
METRIC RATING
158th/ 347
METRIC RANK
79.9%
IN LABOR FORCE | AGE 20-64
87.7/ 100
METRIC RATING
132nd/ 347
METRIC RANK
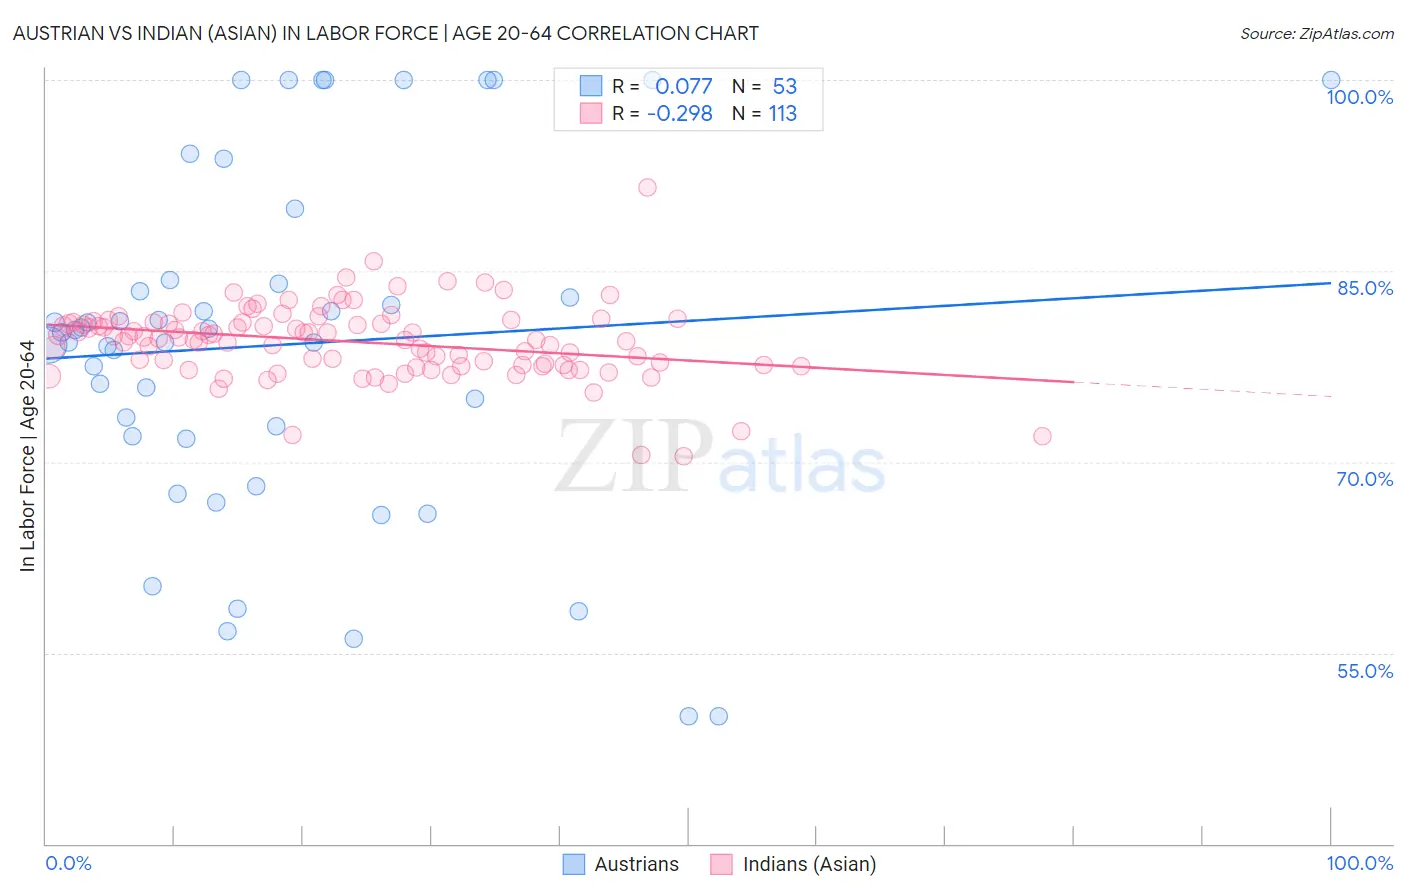
Austrian vs Indian (Asian) In Labor Force | Age 20-64 Correlation Chart
The statistical analysis conducted on geographies consisting of 452,086,784 people shows a slight positive correlation between the proportion of Austrians and labor force participation rate among population between the ages 20 and 64 in the United States with a correlation coefficient (R) of 0.077 and weighted average of 79.7%. Similarly, the statistical analysis conducted on geographies consisting of 495,369,997 people shows a weak negative correlation between the proportion of Indians (Asian) and labor force participation rate among population between the ages 20 and 64 in the United States with a correlation coefficient (R) of -0.298 and weighted average of 79.9%, a difference of 0.25%.
In Labor Force | Age 20-64 Correlation Summary
| Measurement | Austrian | Indian (Asian) |
| Minimum | 50.0% | 70.4% |
| Maximum | 100.0% | 91.6% |
| Range | 50.0% | 21.2% |
| Mean | 79.2% | 79.5% |
| Median | 80.2% | 79.8% |
| Interquartile 25% (IQ1) | 71.9% | 77.6% |
| Interquartile 75% (IQ3) | 84.2% | 81.0% |
| Interquartile Range (IQR) | 12.3% | 3.3% |
| Standard Deviation (Sample) | 13.5% | 3.0% |
| Standard Deviation (Population) | 13.4% | 2.9% |
Similar Demographics by In Labor Force | Age 20-64
Demographics Similar to Austrians by In Labor Force | Age 20-64
In terms of in labor force | age 20-64, the demographic groups most similar to Austrians are Immigrants from South Africa (79.7%, a difference of 0.010%), Senegalese (79.7%, a difference of 0.010%), Immigrants from China (79.7%, a difference of 0.010%), Immigrants from Cuba (79.7%, a difference of 0.010%), and Moroccan (79.7%, a difference of 0.010%).
| Demographics | Rating | Rank | In Labor Force | Age 20-64 |
| Scandinavians | 72.0 /100 | #151 | Good 79.7% |
| Immigrants | Northern Europe | 72.0 /100 | #152 | Good 79.7% |
| Immigrants | Kazakhstan | 69.5 /100 | #153 | Good 79.7% |
| New Zealanders | 69.4 /100 | #154 | Good 79.7% |
| Immigrants | South Africa | 69.2 /100 | #155 | Good 79.7% |
| Senegalese | 69.1 /100 | #156 | Good 79.7% |
| Immigrants | China | 69.1 /100 | #157 | Good 79.7% |
| Austrians | 67.6 /100 | #158 | Good 79.7% |
| Immigrants | Cuba | 66.7 /100 | #159 | Good 79.7% |
| Moroccans | 66.7 /100 | #160 | Good 79.7% |
| South Africans | 66.2 /100 | #161 | Good 79.7% |
| Germans | 65.2 /100 | #162 | Good 79.7% |
| Immigrants | Costa Rica | 64.6 /100 | #163 | Good 79.7% |
| Immigrants | Burma/Myanmar | 64.4 /100 | #164 | Good 79.7% |
| Nigerians | 64.0 /100 | #165 | Good 79.7% |
Demographics Similar to Indians (Asian) by In Labor Force | Age 20-64
In terms of in labor force | age 20-64, the demographic groups most similar to Indians (Asian) are South American Indian (79.9%, a difference of 0.0%), Belgian (79.9%, a difference of 0.0%), Immigrants from Iran (79.9%, a difference of 0.010%), Italian (79.9%, a difference of 0.020%), and Immigrants from Zaire (79.9%, a difference of 0.020%).
| Demographics | Rating | Rank | In Labor Force | Age 20-64 |
| Danes | 91.5 /100 | #125 | Exceptional 79.9% |
| Immigrants | France | 90.7 /100 | #126 | Exceptional 79.9% |
| Immigrants | Czechoslovakia | 89.7 /100 | #127 | Excellent 79.9% |
| Immigrants | Eastern Asia | 89.4 /100 | #128 | Excellent 79.9% |
| Italians | 88.9 /100 | #129 | Excellent 79.9% |
| Immigrants | Zaire | 88.6 /100 | #130 | Excellent 79.9% |
| Immigrants | Iran | 88.3 /100 | #131 | Excellent 79.9% |
| Indians (Asian) | 87.7 /100 | #132 | Excellent 79.9% |
| South American Indians | 87.6 /100 | #133 | Excellent 79.9% |
| Belgians | 87.4 /100 | #134 | Excellent 79.9% |
| Ukrainians | 86.8 /100 | #135 | Excellent 79.9% |
| Immigrants | Singapore | 86.7 /100 | #136 | Excellent 79.9% |
| Immigrants | Ukraine | 86.5 /100 | #137 | Excellent 79.9% |
| Immigrants | Nigeria | 86.4 /100 | #138 | Excellent 79.9% |
| Immigrants | Spain | 83.9 /100 | #139 | Excellent 79.8% |