Austrian vs Immigrants from Middle Africa In Labor Force | Age 20-64
COMPARE
Austrian
Immigrants from Middle Africa
In Labor Force | Age 20-64
In Labor Force | Age 20-64 Comparison
Austrians
Immigrants from Middle Africa
79.7%
IN LABOR FORCE | AGE 20-64
67.6/ 100
METRIC RATING
158th/ 347
METRIC RANK
80.5%
IN LABOR FORCE | AGE 20-64
99.7/ 100
METRIC RATING
44th/ 347
METRIC RANK
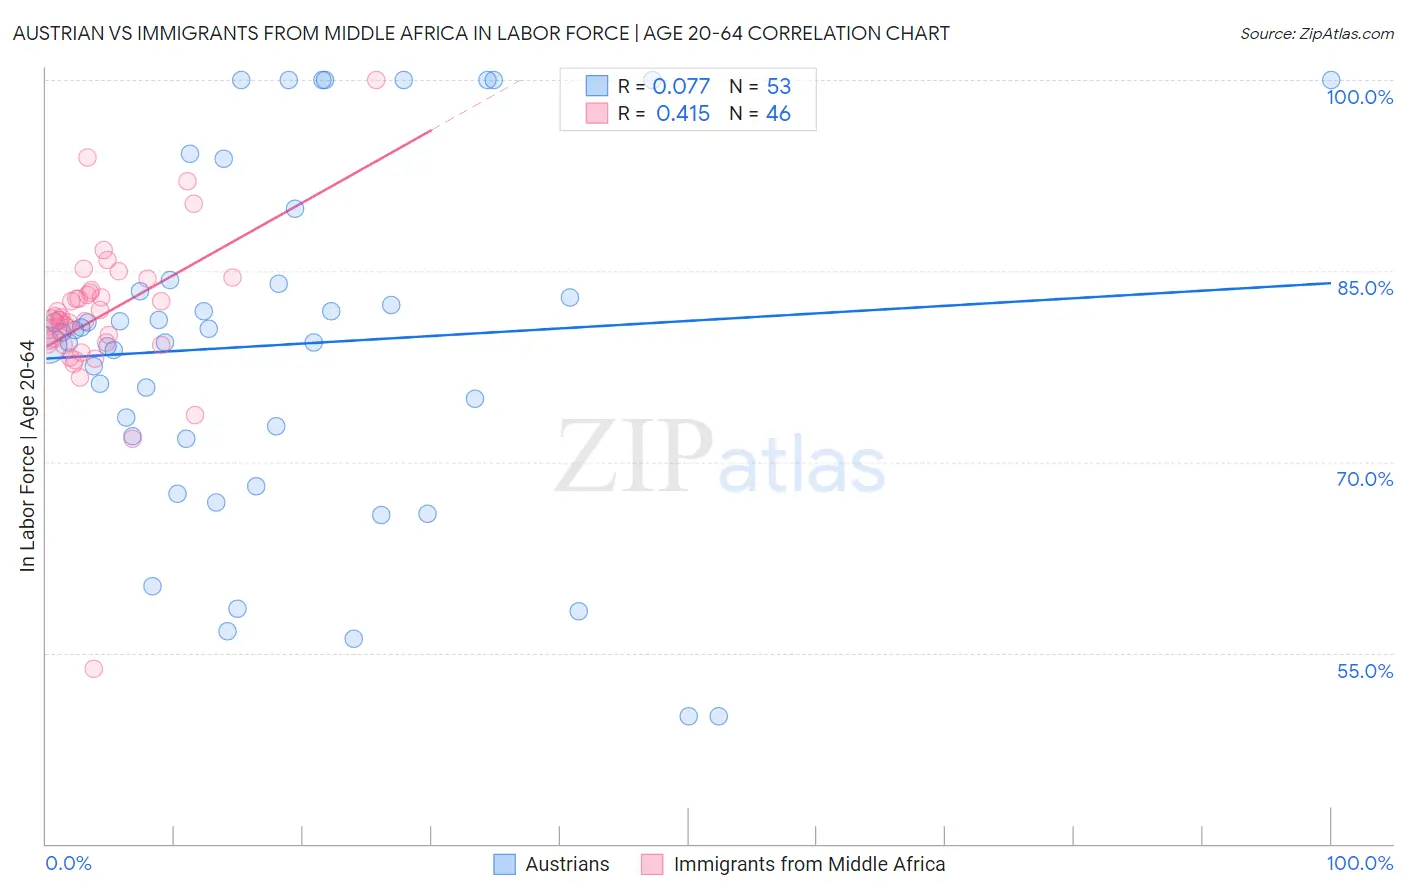
Austrian vs Immigrants from Middle Africa In Labor Force | Age 20-64 Correlation Chart
The statistical analysis conducted on geographies consisting of 452,086,784 people shows a slight positive correlation between the proportion of Austrians and labor force participation rate among population between the ages 20 and 64 in the United States with a correlation coefficient (R) of 0.077 and weighted average of 79.7%. Similarly, the statistical analysis conducted on geographies consisting of 202,739,694 people shows a moderate positive correlation between the proportion of Immigrants from Middle Africa and labor force participation rate among population between the ages 20 and 64 in the United States with a correlation coefficient (R) of 0.415 and weighted average of 80.5%, a difference of 1.0%.
In Labor Force | Age 20-64 Correlation Summary
| Measurement | Austrian | Immigrants from Middle Africa |
| Minimum | 50.0% | 53.7% |
| Maximum | 100.0% | 100.0% |
| Range | 50.0% | 46.3% |
| Mean | 79.2% | 81.5% |
| Median | 80.2% | 81.2% |
| Interquartile 25% (IQ1) | 71.9% | 79.4% |
| Interquartile 75% (IQ3) | 84.2% | 83.3% |
| Interquartile Range (IQR) | 12.3% | 3.9% |
| Standard Deviation (Sample) | 13.5% | 6.4% |
| Standard Deviation (Population) | 13.4% | 6.3% |
Similar Demographics by In Labor Force | Age 20-64
Demographics Similar to Austrians by In Labor Force | Age 20-64
In terms of in labor force | age 20-64, the demographic groups most similar to Austrians are Immigrants from South Africa (79.7%, a difference of 0.010%), Senegalese (79.7%, a difference of 0.010%), Immigrants from China (79.7%, a difference of 0.010%), Immigrants from Cuba (79.7%, a difference of 0.010%), and Moroccan (79.7%, a difference of 0.010%).
| Demographics | Rating | Rank | In Labor Force | Age 20-64 |
| Scandinavians | 72.0 /100 | #151 | Good 79.7% |
| Immigrants | Northern Europe | 72.0 /100 | #152 | Good 79.7% |
| Immigrants | Kazakhstan | 69.5 /100 | #153 | Good 79.7% |
| New Zealanders | 69.4 /100 | #154 | Good 79.7% |
| Immigrants | South Africa | 69.2 /100 | #155 | Good 79.7% |
| Senegalese | 69.1 /100 | #156 | Good 79.7% |
| Immigrants | China | 69.1 /100 | #157 | Good 79.7% |
| Austrians | 67.6 /100 | #158 | Good 79.7% |
| Immigrants | Cuba | 66.7 /100 | #159 | Good 79.7% |
| Moroccans | 66.7 /100 | #160 | Good 79.7% |
| South Africans | 66.2 /100 | #161 | Good 79.7% |
| Germans | 65.2 /100 | #162 | Good 79.7% |
| Immigrants | Costa Rica | 64.6 /100 | #163 | Good 79.7% |
| Immigrants | Burma/Myanmar | 64.4 /100 | #164 | Good 79.7% |
| Nigerians | 64.0 /100 | #165 | Good 79.7% |
Demographics Similar to Immigrants from Middle Africa by In Labor Force | Age 20-64
In terms of in labor force | age 20-64, the demographic groups most similar to Immigrants from Middle Africa are Slovene (80.5%, a difference of 0.020%), Czech (80.5%, a difference of 0.030%), Immigrants from Pakistan (80.5%, a difference of 0.030%), Latvian (80.5%, a difference of 0.040%), and Immigrants from Liberia (80.5%, a difference of 0.060%).
| Demographics | Rating | Rank | In Labor Force | Age 20-64 |
| Immigrants | Moldova | 99.8 /100 | #37 | Exceptional 80.6% |
| Ugandans | 99.8 /100 | #38 | Exceptional 80.6% |
| Brazilians | 99.8 /100 | #39 | Exceptional 80.5% |
| Immigrants | Zimbabwe | 99.8 /100 | #40 | Exceptional 80.5% |
| Immigrants | Liberia | 99.8 /100 | #41 | Exceptional 80.5% |
| Latvians | 99.8 /100 | #42 | Exceptional 80.5% |
| Czechs | 99.7 /100 | #43 | Exceptional 80.5% |
| Immigrants | Middle Africa | 99.7 /100 | #44 | Exceptional 80.5% |
| Slovenes | 99.7 /100 | #45 | Exceptional 80.5% |
| Immigrants | Pakistan | 99.6 /100 | #46 | Exceptional 80.5% |
| Immigrants | Africa | 99.6 /100 | #47 | Exceptional 80.4% |
| Immigrants | Hong Kong | 99.5 /100 | #48 | Exceptional 80.4% |
| Immigrants | Greece | 99.4 /100 | #49 | Exceptional 80.4% |
| Immigrants | Sudan | 99.4 /100 | #50 | Exceptional 80.4% |
| Immigrants | Sri Lanka | 99.3 /100 | #51 | Exceptional 80.4% |