Immigrants from Korea vs Cherokee In Labor Force | Age 20-64
COMPARE
Immigrants from Korea
Cherokee
In Labor Force | Age 20-64
In Labor Force | Age 20-64 Comparison
Immigrants from Korea
Cherokee
80.3%
IN LABOR FORCE | AGE 20-64
98.8/ 100
METRIC RATING
63rd/ 347
METRIC RANK
76.2%
IN LABOR FORCE | AGE 20-64
0.0/ 100
METRIC RATING
317th/ 347
METRIC RANK
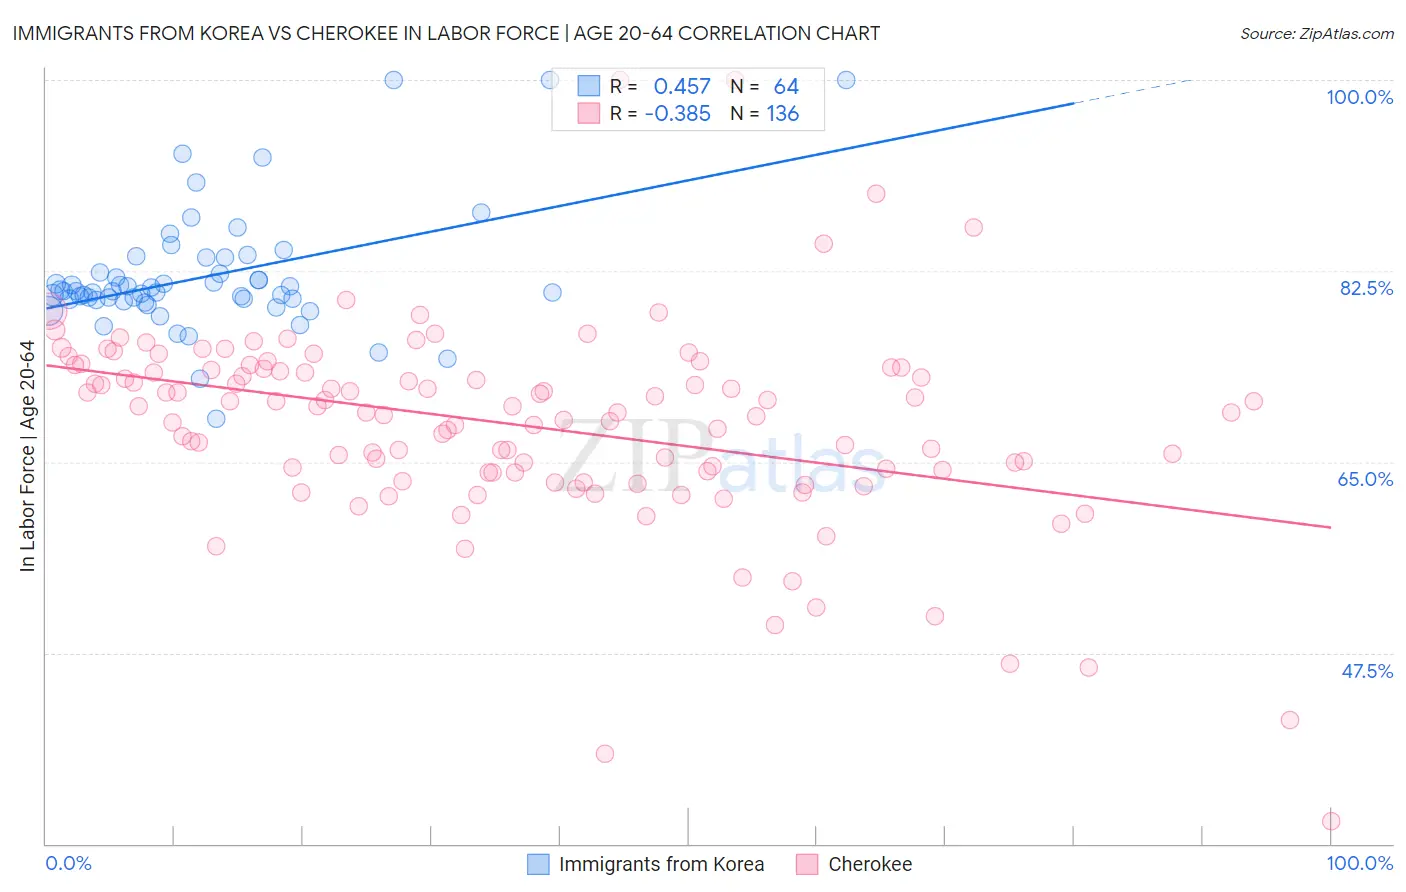
Immigrants from Korea vs Cherokee In Labor Force | Age 20-64 Correlation Chart
The statistical analysis conducted on geographies consisting of 416,355,366 people shows a moderate positive correlation between the proportion of Immigrants from Korea and labor force participation rate among population between the ages 20 and 64 in the United States with a correlation coefficient (R) of 0.457 and weighted average of 80.3%. Similarly, the statistical analysis conducted on geographies consisting of 493,680,494 people shows a mild negative correlation between the proportion of Cherokee and labor force participation rate among population between the ages 20 and 64 in the United States with a correlation coefficient (R) of -0.385 and weighted average of 76.2%, a difference of 5.3%.
In Labor Force | Age 20-64 Correlation Summary
| Measurement | Immigrants from Korea | Cherokee |
| Minimum | 68.9% | 32.1% |
| Maximum | 100.0% | 100.0% |
| Range | 31.1% | 67.9% |
| Mean | 82.0% | 68.4% |
| Median | 80.6% | 69.6% |
| Interquartile 25% (IQ1) | 79.9% | 64.0% |
| Interquartile 75% (IQ3) | 83.1% | 73.5% |
| Interquartile Range (IQR) | 3.2% | 9.5% |
| Standard Deviation (Sample) | 5.6% | 9.3% |
| Standard Deviation (Population) | 5.6% | 9.3% |
Similar Demographics by In Labor Force | Age 20-64
Demographics Similar to Immigrants from Korea by In Labor Force | Age 20-64
In terms of in labor force | age 20-64, the demographic groups most similar to Immigrants from Korea are Immigrants from Albania (80.3%, a difference of 0.0%), Tongan (80.3%, a difference of 0.010%), Burmese (80.3%, a difference of 0.010%), Carpatho Rusyn (80.3%, a difference of 0.010%), and Lithuanian (80.2%, a difference of 0.010%).
| Demographics | Rating | Rank | In Labor Force | Age 20-64 |
| Immigrants | Northern Africa | 99.0 /100 | #56 | Exceptional 80.3% |
| Afghans | 98.9 /100 | #57 | Exceptional 80.3% |
| Serbians | 98.9 /100 | #58 | Exceptional 80.3% |
| Swedes | 98.9 /100 | #59 | Exceptional 80.3% |
| Tongans | 98.8 /100 | #60 | Exceptional 80.3% |
| Burmese | 98.8 /100 | #61 | Exceptional 80.3% |
| Carpatho Rusyns | 98.8 /100 | #62 | Exceptional 80.3% |
| Immigrants | Korea | 98.8 /100 | #63 | Exceptional 80.3% |
| Immigrants | Albania | 98.7 /100 | #64 | Exceptional 80.3% |
| Lithuanians | 98.7 /100 | #65 | Exceptional 80.2% |
| Macedonians | 98.7 /100 | #66 | Exceptional 80.2% |
| Taiwanese | 98.6 /100 | #67 | Exceptional 80.2% |
| Bhutanese | 98.6 /100 | #68 | Exceptional 80.2% |
| Albanians | 98.6 /100 | #69 | Exceptional 80.2% |
| Immigrants | Turkey | 98.5 /100 | #70 | Exceptional 80.2% |
Demographics Similar to Cherokee by In Labor Force | Age 20-64
In terms of in labor force | age 20-64, the demographic groups most similar to Cherokee are Chickasaw (76.2%, a difference of 0.040%), Inupiat (76.1%, a difference of 0.21%), Yaqui (76.5%, a difference of 0.40%), Ottawa (76.7%, a difference of 0.59%), and Yakama (75.8%, a difference of 0.59%).
| Demographics | Rating | Rank | In Labor Force | Age 20-64 |
| Comanche | 0.0 /100 | #310 | Tragic 77.0% |
| Blackfeet | 0.0 /100 | #311 | Tragic 77.0% |
| Alaskan Athabascans | 0.0 /100 | #312 | Tragic 76.9% |
| Shoshone | 0.0 /100 | #313 | Tragic 76.8% |
| Blacks/African Americans | 0.0 /100 | #314 | Tragic 76.8% |
| Ottawa | 0.0 /100 | #315 | Tragic 76.7% |
| Yaqui | 0.0 /100 | #316 | Tragic 76.5% |
| Cherokee | 0.0 /100 | #317 | Tragic 76.2% |
| Chickasaw | 0.0 /100 | #318 | Tragic 76.2% |
| Inupiat | 0.0 /100 | #319 | Tragic 76.1% |
| Yakama | 0.0 /100 | #320 | Tragic 75.8% |
| Seminole | 0.0 /100 | #321 | Tragic 75.5% |
| Dutch West Indians | 0.0 /100 | #322 | Tragic 75.5% |
| Cajuns | 0.0 /100 | #323 | Tragic 75.5% |
| Choctaw | 0.0 /100 | #324 | Tragic 75.4% |