Austrian vs Cherokee Disability Age Under 5
COMPARE
Austrian
Cherokee
Disability Age Under 5
Disability Age Under 5 Comparison
Austrians
Cherokee
1.4%
DISABILITY AGE UNDER 5
0.1/ 100
METRIC RATING
269th/ 347
METRIC RANK
1.8%
DISABILITY AGE UNDER 5
0.0/ 100
METRIC RATING
324th/ 347
METRIC RANK
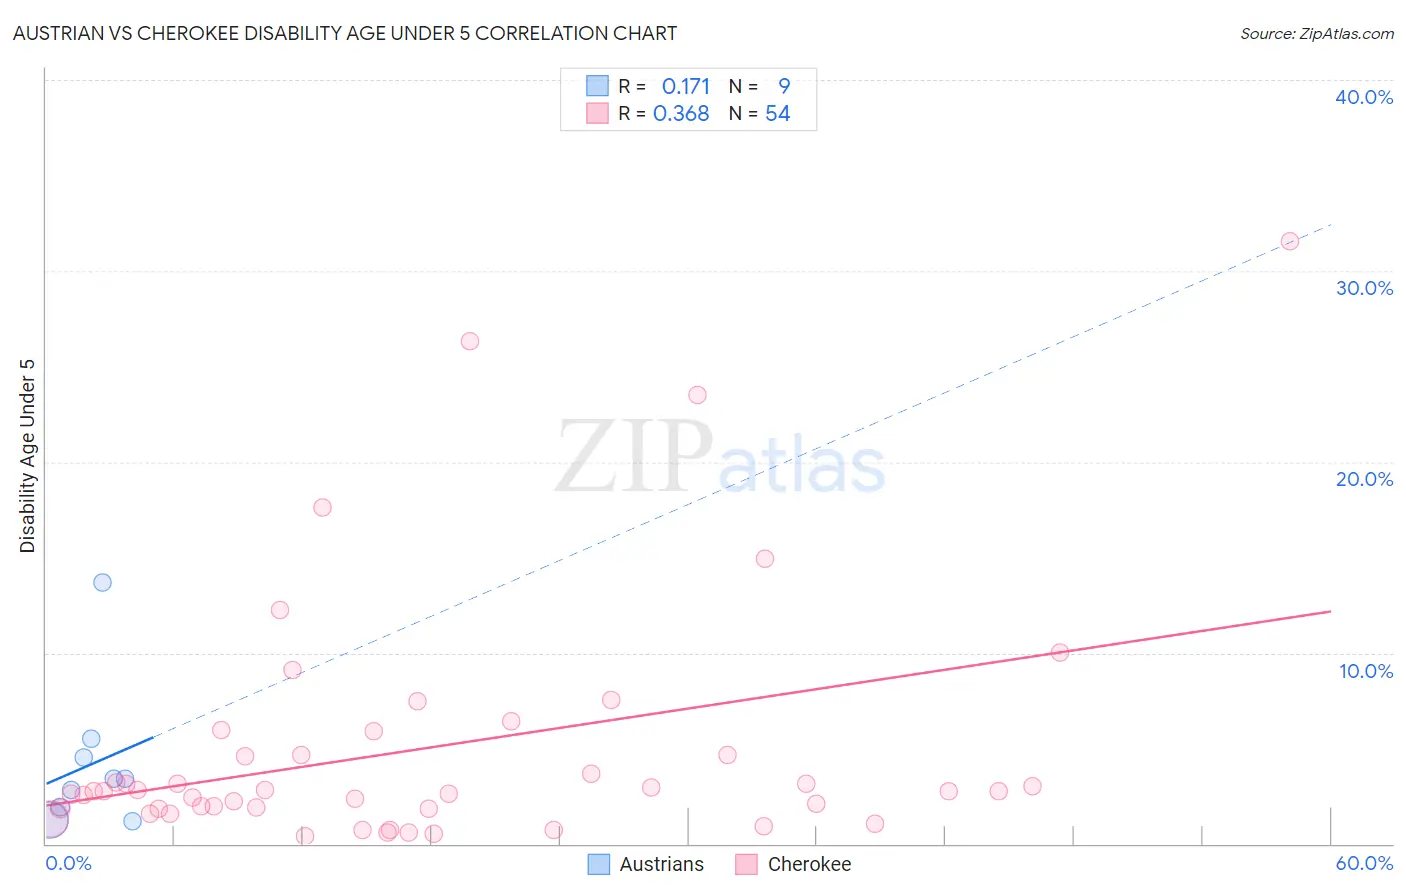
Austrian vs Cherokee Disability Age Under 5 Correlation Chart
The statistical analysis conducted on geographies consisting of 227,811,367 people shows a poor positive correlation between the proportion of Austrians and percentage of population with a disability under the age of 5 in the United States with a correlation coefficient (R) of 0.171 and weighted average of 1.4%. Similarly, the statistical analysis conducted on geographies consisting of 245,498,601 people shows a mild positive correlation between the proportion of Cherokee and percentage of population with a disability under the age of 5 in the United States with a correlation coefficient (R) of 0.368 and weighted average of 1.8%, a difference of 22.9%.
Disability Age Under 5 Correlation Summary
| Measurement | Austrian | Cherokee |
| Minimum | 1.2% | 0.42% |
| Maximum | 13.7% | 31.6% |
| Range | 12.5% | 31.2% |
| Mean | 4.2% | 5.0% |
| Median | 3.4% | 2.8% |
| Interquartile 25% (IQ1) | 1.6% | 1.9% |
| Interquartile 75% (IQ3) | 5.0% | 4.7% |
| Interquartile Range (IQR) | 3.4% | 2.8% |
| Standard Deviation (Sample) | 3.8% | 6.5% |
| Standard Deviation (Population) | 3.6% | 6.4% |
Similar Demographics by Disability Age Under 5
Demographics Similar to Austrians by Disability Age Under 5
In terms of disability age under 5, the demographic groups most similar to Austrians are Immigrants from North America (1.4%, a difference of 0.13%), Immigrants from Canada (1.4%, a difference of 0.17%), Belgian (1.4%, a difference of 0.18%), Black/African American (1.4%, a difference of 0.33%), and Alaskan Athabascan (1.5%, a difference of 0.63%).
| Demographics | Rating | Rank | Disability Age Under 5 |
| Immigrants | Dominica | 0.2 /100 | #262 | Tragic 1.4% |
| Spanish | 0.2 /100 | #263 | Tragic 1.4% |
| Yugoslavians | 0.1 /100 | #264 | Tragic 1.4% |
| Carpatho Rusyns | 0.1 /100 | #265 | Tragic 1.4% |
| Immigrants | Germany | 0.1 /100 | #266 | Tragic 1.4% |
| Cree | 0.1 /100 | #267 | Tragic 1.4% |
| Belgians | 0.1 /100 | #268 | Tragic 1.4% |
| Austrians | 0.1 /100 | #269 | Tragic 1.4% |
| Immigrants | North America | 0.1 /100 | #270 | Tragic 1.4% |
| Immigrants | Canada | 0.1 /100 | #271 | Tragic 1.4% |
| Blacks/African Americans | 0.1 /100 | #272 | Tragic 1.4% |
| Alaskan Athabascans | 0.1 /100 | #273 | Tragic 1.5% |
| Iroquois | 0.0 /100 | #274 | Tragic 1.5% |
| Brazilians | 0.0 /100 | #275 | Tragic 1.5% |
| Greeks | 0.0 /100 | #276 | Tragic 1.5% |
Demographics Similar to Cherokee by Disability Age Under 5
In terms of disability age under 5, the demographic groups most similar to Cherokee are Immigrants from Portugal (1.8%, a difference of 1.3%), Chickasaw (1.7%, a difference of 1.8%), Sioux (1.8%, a difference of 2.8%), German (1.7%, a difference of 2.9%), and Osage (1.8%, a difference of 3.2%).
| Demographics | Rating | Rank | Disability Age Under 5 |
| French | 0.0 /100 | #317 | Tragic 1.7% |
| Irish | 0.0 /100 | #318 | Tragic 1.7% |
| Slovaks | 0.0 /100 | #319 | Tragic 1.7% |
| Scotch-Irish | 0.0 /100 | #320 | Tragic 1.7% |
| Ottawa | 0.0 /100 | #321 | Tragic 1.7% |
| Germans | 0.0 /100 | #322 | Tragic 1.7% |
| Chickasaw | 0.0 /100 | #323 | Tragic 1.7% |
| Cherokee | 0.0 /100 | #324 | Tragic 1.8% |
| Immigrants | Portugal | 0.0 /100 | #325 | Tragic 1.8% |
| Sioux | 0.0 /100 | #326 | Tragic 1.8% |
| Osage | 0.0 /100 | #327 | Tragic 1.8% |
| Americans | 0.0 /100 | #328 | Tragic 1.9% |
| Houma | 0.0 /100 | #329 | Tragic 1.9% |
| Choctaw | 0.0 /100 | #330 | Tragic 1.9% |
| French Canadians | 0.0 /100 | #331 | Tragic 1.9% |