Tohono O'odham vs Cherokee In Labor Force | Age 20-64
COMPARE
Tohono O'odham
Cherokee
In Labor Force | Age 20-64
In Labor Force | Age 20-64 Comparison
Tohono O'odham
Cherokee
70.4%
IN LABOR FORCE | AGE 20-64
0.0/ 100
METRIC RATING
345th/ 347
METRIC RANK
76.2%
IN LABOR FORCE | AGE 20-64
0.0/ 100
METRIC RATING
317th/ 347
METRIC RANK
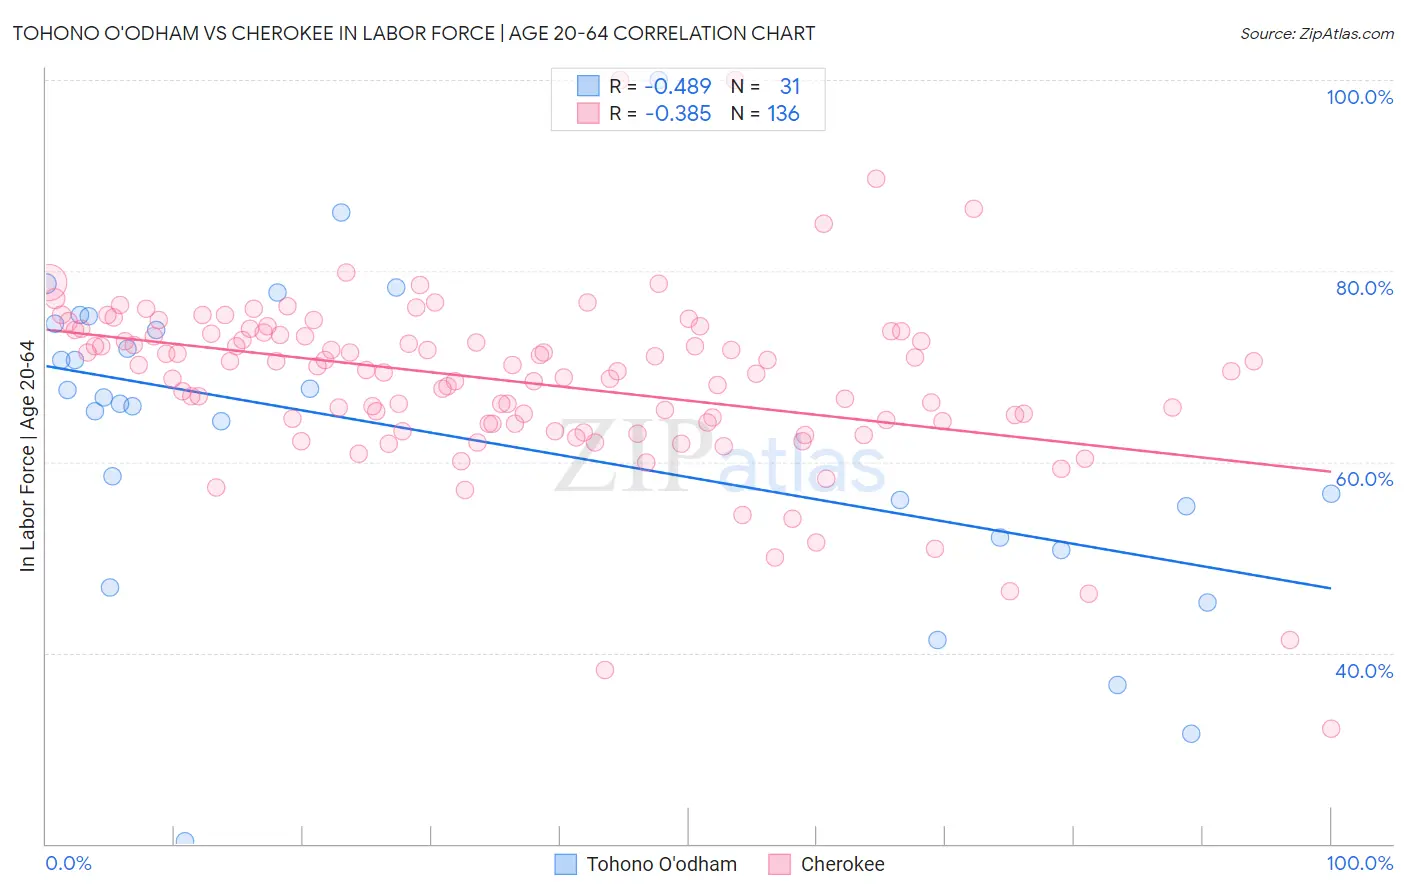
Tohono O'odham vs Cherokee In Labor Force | Age 20-64 Correlation Chart
The statistical analysis conducted on geographies consisting of 58,725,287 people shows a moderate negative correlation between the proportion of Tohono O'odham and labor force participation rate among population between the ages 20 and 64 in the United States with a correlation coefficient (R) of -0.489 and weighted average of 70.4%. Similarly, the statistical analysis conducted on geographies consisting of 493,680,494 people shows a mild negative correlation between the proportion of Cherokee and labor force participation rate among population between the ages 20 and 64 in the United States with a correlation coefficient (R) of -0.385 and weighted average of 76.2%, a difference of 8.3%.
In Labor Force | Age 20-64 Correlation Summary
| Measurement | Tohono O'odham | Cherokee |
| Minimum | 20.2% | 32.1% |
| Maximum | 100.0% | 100.0% |
| Range | 79.8% | 67.9% |
| Mean | 62.8% | 68.4% |
| Median | 66.1% | 69.6% |
| Interquartile 25% (IQ1) | 52.1% | 64.0% |
| Interquartile 75% (IQ3) | 74.5% | 73.5% |
| Interquartile Range (IQR) | 22.4% | 9.5% |
| Standard Deviation (Sample) | 16.8% | 9.3% |
| Standard Deviation (Population) | 16.5% | 9.3% |
Similar Demographics by In Labor Force | Age 20-64
Demographics Similar to Tohono O'odham by In Labor Force | Age 20-64
In terms of in labor force | age 20-64, the demographic groups most similar to Tohono O'odham are Lumbee (70.6%, a difference of 0.33%), Navajo (69.2%, a difference of 1.8%), Hopi (71.7%, a difference of 1.9%), Yuman (71.7%, a difference of 1.9%), and Pima (69.0%, a difference of 2.0%).
| Demographics | Rating | Rank | In Labor Force | Age 20-64 |
| Natives/Alaskans | 0.0 /100 | #333 | Tragic 73.9% |
| Apache | 0.0 /100 | #334 | Tragic 73.7% |
| Ute | 0.0 /100 | #335 | Tragic 73.7% |
| Crow | 0.0 /100 | #336 | Tragic 73.3% |
| Yup'ik | 0.0 /100 | #337 | Tragic 73.2% |
| Puerto Ricans | 0.0 /100 | #338 | Tragic 73.1% |
| Houma | 0.0 /100 | #339 | Tragic 72.7% |
| Pueblo | 0.0 /100 | #340 | Tragic 72.6% |
| Immigrants | Yemen | 0.0 /100 | #341 | Tragic 72.3% |
| Yuman | 0.0 /100 | #342 | Tragic 71.7% |
| Hopi | 0.0 /100 | #343 | Tragic 71.7% |
| Lumbee | 0.0 /100 | #344 | Tragic 70.6% |
| Tohono O'odham | 0.0 /100 | #345 | Tragic 70.4% |
| Navajo | 0.0 /100 | #346 | Tragic 69.2% |
| Pima | 0.0 /100 | #347 | Tragic 69.0% |
Demographics Similar to Cherokee by In Labor Force | Age 20-64
In terms of in labor force | age 20-64, the demographic groups most similar to Cherokee are Chickasaw (76.2%, a difference of 0.040%), Inupiat (76.1%, a difference of 0.21%), Yaqui (76.5%, a difference of 0.40%), Ottawa (76.7%, a difference of 0.59%), and Yakama (75.8%, a difference of 0.59%).
| Demographics | Rating | Rank | In Labor Force | Age 20-64 |
| Comanche | 0.0 /100 | #310 | Tragic 77.0% |
| Blackfeet | 0.0 /100 | #311 | Tragic 77.0% |
| Alaskan Athabascans | 0.0 /100 | #312 | Tragic 76.9% |
| Shoshone | 0.0 /100 | #313 | Tragic 76.8% |
| Blacks/African Americans | 0.0 /100 | #314 | Tragic 76.8% |
| Ottawa | 0.0 /100 | #315 | Tragic 76.7% |
| Yaqui | 0.0 /100 | #316 | Tragic 76.5% |
| Cherokee | 0.0 /100 | #317 | Tragic 76.2% |
| Chickasaw | 0.0 /100 | #318 | Tragic 76.2% |
| Inupiat | 0.0 /100 | #319 | Tragic 76.1% |
| Yakama | 0.0 /100 | #320 | Tragic 75.8% |
| Seminole | 0.0 /100 | #321 | Tragic 75.5% |
| Dutch West Indians | 0.0 /100 | #322 | Tragic 75.5% |
| Cajuns | 0.0 /100 | #323 | Tragic 75.5% |
| Choctaw | 0.0 /100 | #324 | Tragic 75.4% |