Argentinean vs South American Indian In Labor Force | Age > 16
COMPARE
Argentinean
South American Indian
In Labor Force | Age > 16
In Labor Force | Age > 16 Comparison
Argentineans
South American Indians
65.7%
IN LABOR FORCE | AGE > 16
96.7/ 100
METRIC RATING
116th/ 347
METRIC RANK
66.0%
IN LABOR FORCE | AGE > 16
99.4/ 100
METRIC RATING
87th/ 347
METRIC RANK
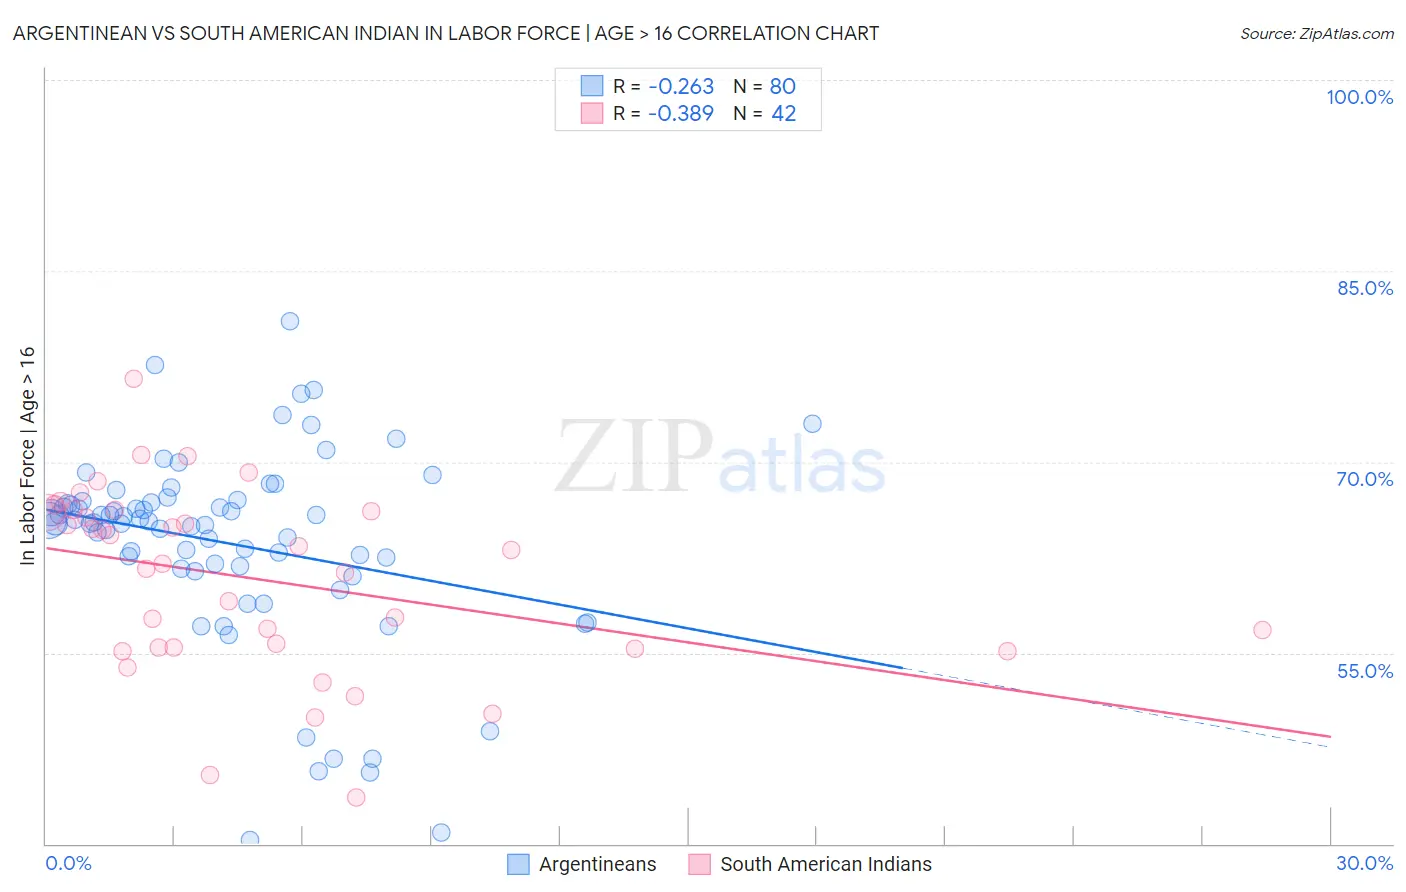
Argentinean vs South American Indian In Labor Force | Age > 16 Correlation Chart
The statistical analysis conducted on geographies consisting of 297,149,782 people shows a weak negative correlation between the proportion of Argentineans and labor force participation rate among population ages 16 and over in the United States with a correlation coefficient (R) of -0.263 and weighted average of 65.7%. Similarly, the statistical analysis conducted on geographies consisting of 164,562,228 people shows a mild negative correlation between the proportion of South American Indians and labor force participation rate among population ages 16 and over in the United States with a correlation coefficient (R) of -0.389 and weighted average of 66.0%, a difference of 0.46%.
In Labor Force | Age > 16 Correlation Summary
| Measurement | Argentinean | South American Indian |
| Minimum | 40.3% | 43.6% |
| Maximum | 81.0% | 76.5% |
| Range | 40.7% | 32.9% |
| Mean | 63.6% | 60.8% |
| Median | 65.3% | 62.6% |
| Interquartile 25% (IQ1) | 61.7% | 55.4% |
| Interquartile 75% (IQ3) | 66.9% | 66.1% |
| Interquartile Range (IQR) | 5.2% | 10.7% |
| Standard Deviation (Sample) | 7.7% | 7.2% |
| Standard Deviation (Population) | 7.6% | 7.1% |
Similar Demographics by In Labor Force | Age > 16
Demographics Similar to Argentineans by In Labor Force | Age > 16
In terms of in labor force | age > 16, the demographic groups most similar to Argentineans are Immigrants from Indonesia (65.7%, a difference of 0.010%), Immigrants from Iran (65.7%, a difference of 0.010%), Immigrants from Thailand (65.7%, a difference of 0.010%), Immigrants from France (65.7%, a difference of 0.020%), and Pakistani (65.8%, a difference of 0.040%).
| Demographics | Rating | Rank | In Labor Force | Age > 16 |
| Immigrants | Japan | 98.0 /100 | #109 | Exceptional 65.8% |
| Japanese | 97.7 /100 | #110 | Exceptional 65.8% |
| Immigrants | Honduras | 97.5 /100 | #111 | Exceptional 65.8% |
| Laotians | 97.4 /100 | #112 | Exceptional 65.8% |
| Pakistanis | 97.1 /100 | #113 | Exceptional 65.8% |
| Hondurans | 97.1 /100 | #114 | Exceptional 65.8% |
| Immigrants | Indonesia | 96.8 /100 | #115 | Exceptional 65.7% |
| Argentineans | 96.7 /100 | #116 | Exceptional 65.7% |
| Immigrants | Iran | 96.6 /100 | #117 | Exceptional 65.7% |
| Immigrants | Thailand | 96.6 /100 | #118 | Exceptional 65.7% |
| Immigrants | France | 96.4 /100 | #119 | Exceptional 65.7% |
| Immigrants | Hong Kong | 96.2 /100 | #120 | Exceptional 65.7% |
| New Zealanders | 96.0 /100 | #121 | Exceptional 65.7% |
| Immigrants | Ecuador | 95.9 /100 | #122 | Exceptional 65.7% |
| Immigrants | Iraq | 95.5 /100 | #123 | Exceptional 65.7% |
Demographics Similar to South American Indians by In Labor Force | Age > 16
In terms of in labor force | age > 16, the demographic groups most similar to South American Indians are Bermudan (66.0%, a difference of 0.0%), South American (66.0%, a difference of 0.010%), Mongolian (66.1%, a difference of 0.020%), German Russian (66.1%, a difference of 0.040%), and Immigrants from Jordan (66.1%, a difference of 0.040%).
| Demographics | Rating | Rank | In Labor Force | Age > 16 |
| Malaysians | 99.6 /100 | #80 | Exceptional 66.1% |
| Moroccans | 99.5 /100 | #81 | Exceptional 66.1% |
| German Russians | 99.4 /100 | #82 | Exceptional 66.1% |
| Immigrants | Jordan | 99.4 /100 | #83 | Exceptional 66.1% |
| Central Americans | 99.4 /100 | #84 | Exceptional 66.1% |
| Mongolians | 99.4 /100 | #85 | Exceptional 66.1% |
| South Americans | 99.4 /100 | #86 | Exceptional 66.0% |
| South American Indians | 99.4 /100 | #87 | Exceptional 66.0% |
| Bermudans | 99.3 /100 | #88 | Exceptional 66.0% |
| Immigrants | Laos | 99.2 /100 | #89 | Exceptional 66.0% |
| Chileans | 99.2 /100 | #90 | Exceptional 66.0% |
| Iranians | 99.2 /100 | #91 | Exceptional 66.0% |
| Aleuts | 99.1 /100 | #92 | Exceptional 66.0% |
| Immigrants | South America | 99.1 /100 | #93 | Exceptional 66.0% |
| Immigrants | Cambodia | 99.1 /100 | #94 | Exceptional 66.0% |