Argentinean vs Immigrants from South Africa In Labor Force | Age > 16
COMPARE
Argentinean
Immigrants from South Africa
In Labor Force | Age > 16
In Labor Force | Age > 16 Comparison
Argentineans
Immigrants from South Africa
65.7%
IN LABOR FORCE | AGE > 16
96.7/ 100
METRIC RATING
116th/ 347
METRIC RANK
65.3%
IN LABOR FORCE | AGE > 16
73.5/ 100
METRIC RATING
160th/ 347
METRIC RANK
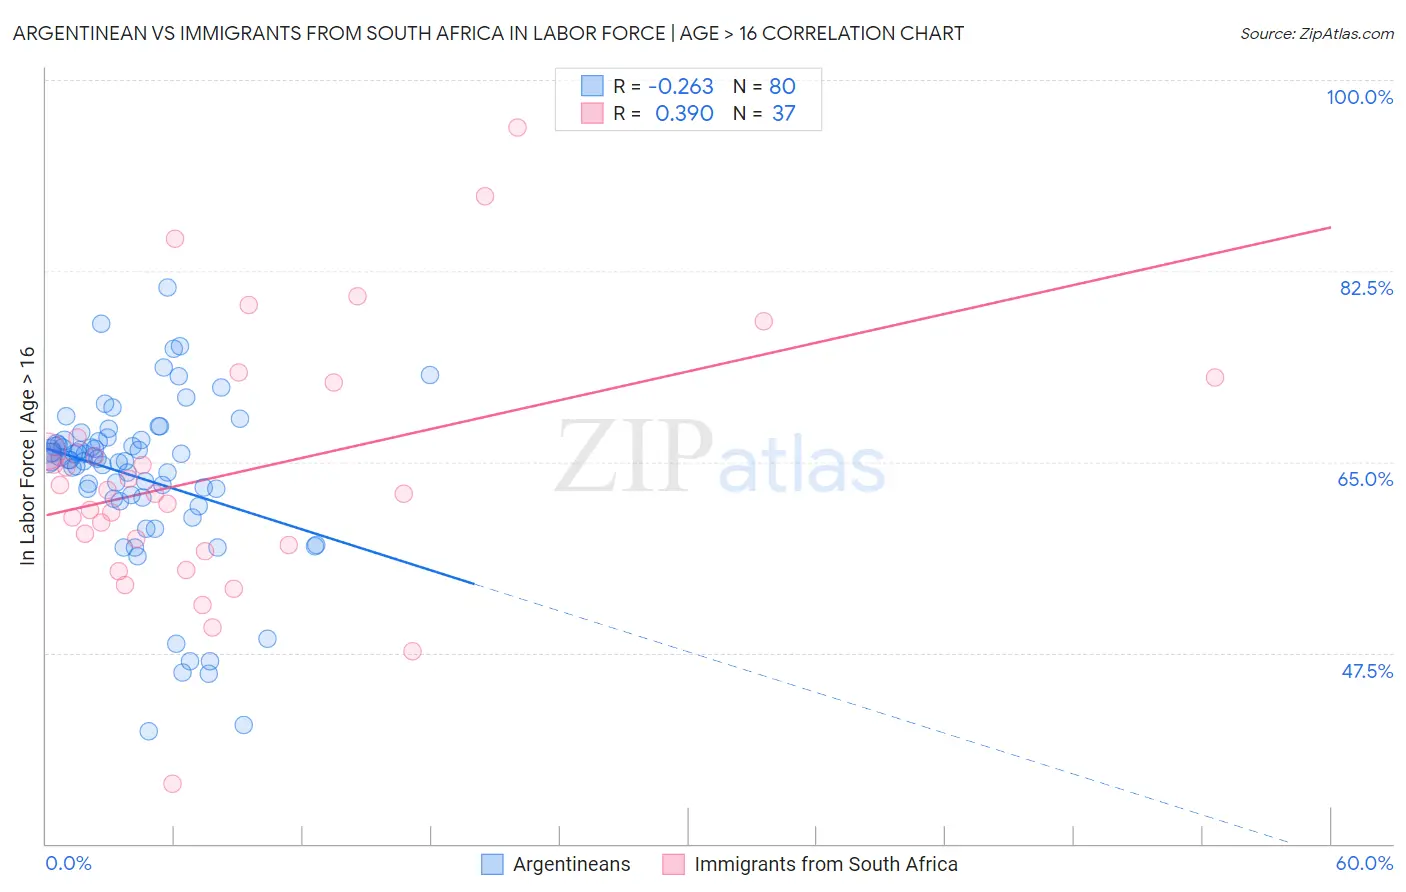
Argentinean vs Immigrants from South Africa In Labor Force | Age > 16 Correlation Chart
The statistical analysis conducted on geographies consisting of 297,149,782 people shows a weak negative correlation between the proportion of Argentineans and labor force participation rate among population ages 16 and over in the United States with a correlation coefficient (R) of -0.263 and weighted average of 65.7%. Similarly, the statistical analysis conducted on geographies consisting of 233,322,326 people shows a mild positive correlation between the proportion of Immigrants from South Africa and labor force participation rate among population ages 16 and over in the United States with a correlation coefficient (R) of 0.390 and weighted average of 65.3%, a difference of 0.66%.
In Labor Force | Age > 16 Correlation Summary
| Measurement | Argentinean | Immigrants from South Africa |
| Minimum | 40.3% | 35.5% |
| Maximum | 81.0% | 95.6% |
| Range | 40.7% | 60.1% |
| Mean | 63.6% | 63.9% |
| Median | 65.3% | 62.1% |
| Interquartile 25% (IQ1) | 61.7% | 57.1% |
| Interquartile 75% (IQ3) | 66.9% | 69.8% |
| Interquartile Range (IQR) | 5.2% | 12.7% |
| Standard Deviation (Sample) | 7.7% | 11.9% |
| Standard Deviation (Population) | 7.6% | 11.7% |
Similar Demographics by In Labor Force | Age > 16
Demographics Similar to Argentineans by In Labor Force | Age > 16
In terms of in labor force | age > 16, the demographic groups most similar to Argentineans are Immigrants from Indonesia (65.7%, a difference of 0.010%), Immigrants from Iran (65.7%, a difference of 0.010%), Immigrants from Thailand (65.7%, a difference of 0.010%), Immigrants from France (65.7%, a difference of 0.020%), and Pakistani (65.8%, a difference of 0.040%).
| Demographics | Rating | Rank | In Labor Force | Age > 16 |
| Immigrants | Japan | 98.0 /100 | #109 | Exceptional 65.8% |
| Japanese | 97.7 /100 | #110 | Exceptional 65.8% |
| Immigrants | Honduras | 97.5 /100 | #111 | Exceptional 65.8% |
| Laotians | 97.4 /100 | #112 | Exceptional 65.8% |
| Pakistanis | 97.1 /100 | #113 | Exceptional 65.8% |
| Hondurans | 97.1 /100 | #114 | Exceptional 65.8% |
| Immigrants | Indonesia | 96.8 /100 | #115 | Exceptional 65.7% |
| Argentineans | 96.7 /100 | #116 | Exceptional 65.7% |
| Immigrants | Iran | 96.6 /100 | #117 | Exceptional 65.7% |
| Immigrants | Thailand | 96.6 /100 | #118 | Exceptional 65.7% |
| Immigrants | France | 96.4 /100 | #119 | Exceptional 65.7% |
| Immigrants | Hong Kong | 96.2 /100 | #120 | Exceptional 65.7% |
| New Zealanders | 96.0 /100 | #121 | Exceptional 65.7% |
| Immigrants | Ecuador | 95.9 /100 | #122 | Exceptional 65.7% |
| Immigrants | Iraq | 95.5 /100 | #123 | Exceptional 65.7% |
Demographics Similar to Immigrants from South Africa by In Labor Force | Age > 16
In terms of in labor force | age > 16, the demographic groups most similar to Immigrants from South Africa are Immigrants from Syria (65.3%, a difference of 0.020%), Immigrants from Russia (65.3%, a difference of 0.030%), Panamanian (65.3%, a difference of 0.030%), Australian (65.3%, a difference of 0.030%), and Immigrants from Ireland (65.3%, a difference of 0.040%).
| Demographics | Rating | Rank | In Labor Force | Age > 16 |
| Immigrants | China | 80.5 /100 | #153 | Excellent 65.4% |
| Immigrants | Eastern Europe | 78.3 /100 | #154 | Good 65.4% |
| Immigrants | Armenia | 76.6 /100 | #155 | Good 65.3% |
| Immigrants | Ireland | 75.9 /100 | #156 | Good 65.3% |
| Immigrants | Russia | 75.7 /100 | #157 | Good 65.3% |
| Panamanians | 75.2 /100 | #158 | Good 65.3% |
| Immigrants | Syria | 74.6 /100 | #159 | Good 65.3% |
| Immigrants | South Africa | 73.5 /100 | #160 | Good 65.3% |
| Australians | 71.3 /100 | #161 | Good 65.3% |
| Albanians | 70.8 /100 | #162 | Good 65.3% |
| South Africans | 69.8 /100 | #163 | Good 65.3% |
| Danes | 68.8 /100 | #164 | Good 65.3% |
| Immigrants | Kazakhstan | 68.1 /100 | #165 | Good 65.3% |
| Immigrants | Western Asia | 67.3 /100 | #166 | Good 65.3% |
| Immigrants | Belarus | 66.0 /100 | #167 | Good 65.2% |