Argentinean vs South American Indian Births to Unmarried Women
COMPARE
Argentinean
South American Indian
Births to Unmarried Women
Births to Unmarried Women Comparison
Argentineans
South American Indians
30.0%
BIRTHS TO UNMARRIED WOMEN
90.5/ 100
METRIC RATING
119th/ 347
METRIC RANK
31.7%
BIRTHS TO UNMARRIED WOMEN
47.7/ 100
METRIC RATING
177th/ 347
METRIC RANK
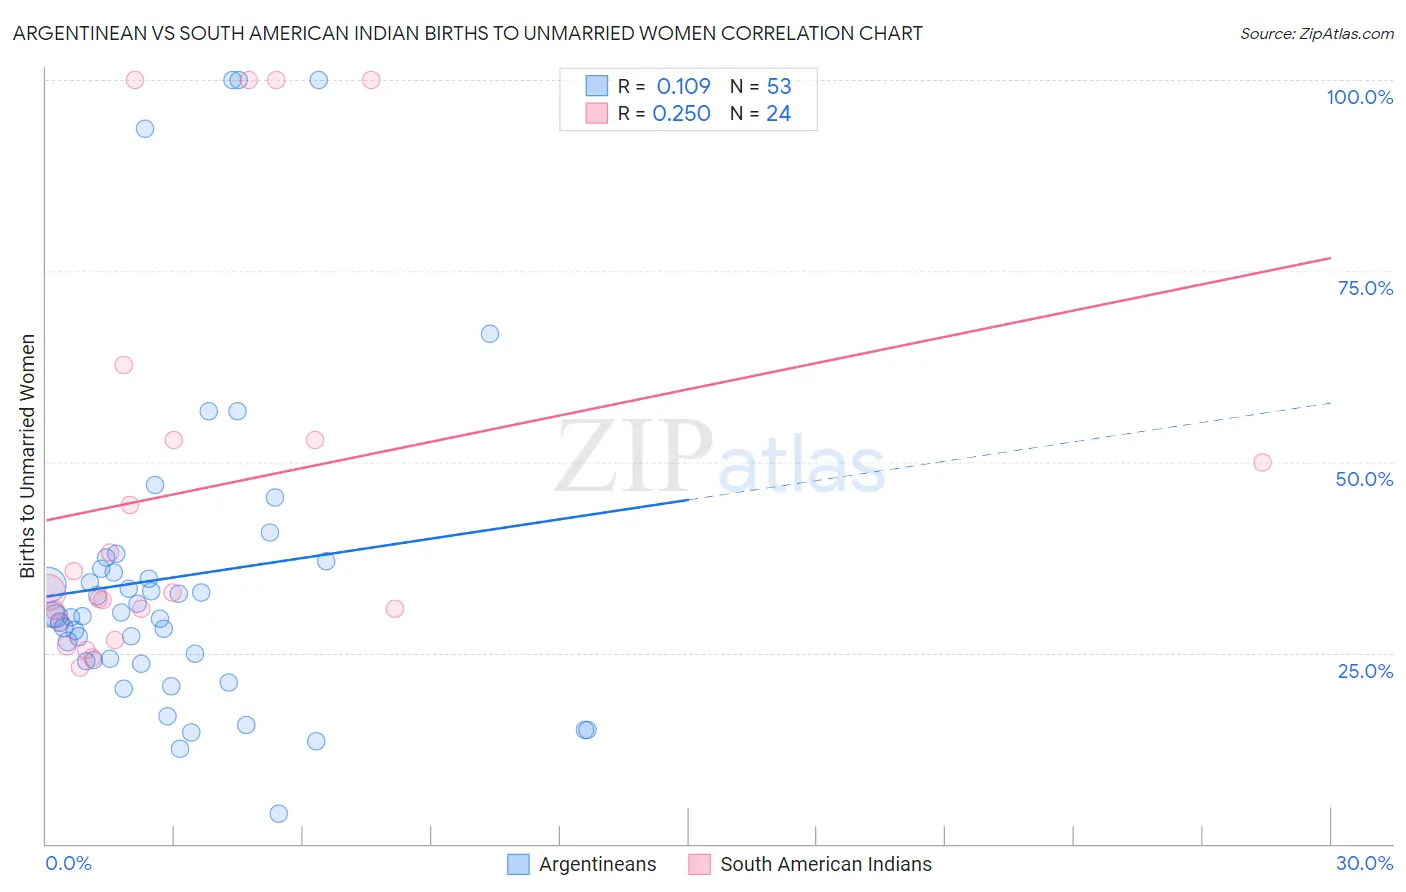
Argentinean vs South American Indian Births to Unmarried Women Correlation Chart
The statistical analysis conducted on geographies consisting of 280,462,153 people shows a poor positive correlation between the proportion of Argentineans and percentage of births to unmarried women in the United States with a correlation coefficient (R) of 0.109 and weighted average of 30.0%. Similarly, the statistical analysis conducted on geographies consisting of 159,564,044 people shows a weak positive correlation between the proportion of South American Indians and percentage of births to unmarried women in the United States with a correlation coefficient (R) of 0.250 and weighted average of 31.7%, a difference of 5.9%.
Births to Unmarried Women Correlation Summary
| Measurement | Argentinean | South American Indian |
| Minimum | 4.0% | 23.0% |
| Maximum | 100.0% | 100.0% |
| Range | 96.0% | 77.0% |
| Mean | 34.9% | 46.4% |
| Median | 29.9% | 32.9% |
| Interquartile 25% (IQ1) | 24.0% | 29.9% |
| Interquartile 75% (IQ3) | 36.5% | 52.9% |
| Interquartile Range (IQR) | 12.5% | 23.0% |
| Standard Deviation (Sample) | 21.5% | 26.5% |
| Standard Deviation (Population) | 21.3% | 25.9% |
Similar Demographics by Births to Unmarried Women
Demographics Similar to Argentineans by Births to Unmarried Women
In terms of births to unmarried women, the demographic groups most similar to Argentineans are Immigrants from Norway (29.9%, a difference of 0.14%), Immigrants from Netherlands (29.9%, a difference of 0.16%), Ugandan (30.1%, a difference of 0.36%), Immigrants from Italy (29.9%, a difference of 0.37%), and Korean (30.1%, a difference of 0.44%).
| Demographics | Rating | Rank | Births to Unmarried Women |
| Basques | 93.0 /100 | #112 | Exceptional 29.7% |
| Scandinavians | 92.7 /100 | #113 | Exceptional 29.8% |
| Immigrants | Croatia | 92.6 /100 | #114 | Exceptional 29.8% |
| Ethiopians | 91.9 /100 | #115 | Exceptional 29.8% |
| Immigrants | Italy | 91.7 /100 | #116 | Exceptional 29.9% |
| Immigrants | Netherlands | 91.1 /100 | #117 | Exceptional 29.9% |
| Immigrants | Norway | 91.0 /100 | #118 | Exceptional 29.9% |
| Argentineans | 90.5 /100 | #119 | Exceptional 30.0% |
| Ugandans | 89.2 /100 | #120 | Excellent 30.1% |
| Koreans | 88.9 /100 | #121 | Excellent 30.1% |
| Immigrants | Argentina | 88.7 /100 | #122 | Excellent 30.1% |
| Syrians | 88.2 /100 | #123 | Excellent 30.2% |
| Croatians | 88.0 /100 | #124 | Excellent 30.2% |
| Vietnamese | 87.7 /100 | #125 | Excellent 30.2% |
| Europeans | 87.2 /100 | #126 | Excellent 30.2% |
Demographics Similar to South American Indians by Births to Unmarried Women
In terms of births to unmarried women, the demographic groups most similar to South American Indians are English (31.7%, a difference of 0.030%), Scottish (31.7%, a difference of 0.040%), South American (31.8%, a difference of 0.070%), Immigrants from Venezuela (31.7%, a difference of 0.14%), and Moroccan (31.8%, a difference of 0.18%).
| Demographics | Rating | Rank | Births to Unmarried Women |
| Guamanians/Chamorros | 51.3 /100 | #170 | Average 31.6% |
| Finns | 50.5 /100 | #171 | Average 31.7% |
| Immigrants | Eritrea | 50.4 /100 | #172 | Average 31.7% |
| Immigrants | Yemen | 50.2 /100 | #173 | Average 31.7% |
| Venezuelans | 50.0 /100 | #174 | Average 31.7% |
| Immigrants | Venezuela | 49.2 /100 | #175 | Average 31.7% |
| Scottish | 48.1 /100 | #176 | Average 31.7% |
| South American Indians | 47.7 /100 | #177 | Average 31.7% |
| English | 47.4 /100 | #178 | Average 31.7% |
| South Americans | 46.9 /100 | #179 | Average 31.8% |
| Moroccans | 45.7 /100 | #180 | Average 31.8% |
| Immigrants | Peru | 45.1 /100 | #181 | Average 31.8% |
| Kenyans | 43.0 /100 | #182 | Average 31.9% |
| Canadians | 41.4 /100 | #183 | Average 31.9% |
| Immigrants | South America | 40.7 /100 | #184 | Average 32.0% |