Immigrants from Netherlands vs South American Indian In Labor Force | Age > 16

COMPARE

Immigrants from Netherlands
Race
Ancestry
AfghanAfricanAlaska NativeAlaskan AthabascanAlbanianAleutAlsatianAmericanApacheArabArapahoArgentineanArmenianAssyrian/Chaldean/SyriacAustralianAustrianBahamianBangladeshiBarbadianBasqueBelgianBelizeanBermudanBhutaneseBlackfeetBolivianBrazilianBritishBritish West IndianBulgarianBurmeseCajunCambodianCanadianCape VerdeanCarpatho RusynCelticCentral AmericanCentral American IndianCherokeeCheyenneChickasawChileanChineseChippewaChoctawColombianColvilleComancheCosta RicanCreeCreekCroatianCrowCubanCypriotCzechCzechoslovakianDanishDelawareDominicanDutchDutch West IndianEastern EuropeanEcuadorianEgyptianEnglishEstonianEthiopianEuropeanFijianFilipinoFinnishFrenchFrench American IndianFrench CanadianGermanGerman RussianGhanaianGreekGuamanian/ChamorroGuatemalanGuyaneseHaitianHmongHonduranHopiHoumaHungarianIcelanderIndian (Asian)IndonesianInupiatIranianIraqiIrishIroquoisIsraeliItalianJamaicanJapaneseJordanianKenyanKiowaKoreanLaotianLatvianLebaneseLiberianLithuanianLumbeeLuxembourgerMacedonianMalaysianMalteseMarshalleseMenomineeMexicanMexican American IndianMongolianMoroccanNative HawaiianNavajoNepaleseNew ZealanderNicaraguanNigerianNorthern EuropeanNorwegianOkinawanOsageOttawaPaiutePakistaniPalestinianPanamanianParaguayanPennsylvania GermanPeruvianPimaPolishPortuguesePotawatomiPuebloPuerto RicanPuget Sound SalishRomanianRussianSalvadoranSamoanScandinavianScotch-IrishScottishSeminoleSenegaleseSerbianShoshoneSierra LeoneanSiouxSlavicSlovakSloveneSomaliSouth AfricanSouth AmericanSoviet UnionSpaniardSpanishSpanish AmericanSpanish American IndianSri LankanSubsaharan AfricanSudaneseSwedishSwissSyrianTaiwaneseThaiTlingit-HaidaTohono O'OdhamTonganTrinidadian and TobagonianTsimshianTurkishU.S. Virgin IslanderUgandanUkrainianUruguayanUteVenezuelanVietnameseWelshWest IndianYakamaYaquiYugoslavianYumanYup'ikZimbabwean
Immigration
NonimmigrantsImmigrantsAfghanistanAfricaAlbaniaArgentinaArmeniaAsiaAustraliaAustriaBahamasBangladeshBarbadosBelarusBelgiumBelizeBoliviaBosnia and HerzegovinaBrazilBulgariaBurma/MyanmarCabo VerdeCambodiaCameroonCanadaCaribbeanCentral AmericaChileChinaColombiaCongoCosta RicaCroatiaCubaCzechoslovakiaDenmarkDominicaDominican RepublicEastern AfricaEastern AsiaEastern EuropeEcuadorEgyptEl SalvadorEnglandEritreaEthiopiaEuropeFijiFranceGermanyGhanaGreeceGrenadaGuatemalaGuyanaHaitiHondurasHong KongHungaryIndiaIndonesiaIranIraqIrelandIsraelItalyJamaicaJapanJordanKazakhstanKenyaKoreaKuwaitLaosLatin AmericaLatviaLebanonLiberiaLithuaniaMalaysiaMexicoMicronesiaMiddle AfricaMoldovaMoroccoNepalNetherlandsNicaraguaNigeriaNorth AmericaNorth MacedoniaNorthern AfricaNorthern EuropeNorwayOceaniaPakistanPanamaPeruPhilippinesPolandPortugalRomaniaRussiaSaudi ArabiaScotlandSenegalSerbiaSierra LeoneSingaporeSomaliaSouth AfricaSouth AmericaSouth Central AsiaSouth Eastern AsiaSouthern EuropeSpainSri LankaSt. Vincent and the GrenadinesSudanSwedenSwitzerlandSyriaTaiwanThailandTrinidad and TobagoTurkeyUgandaUkraineUruguayUzbekistanVenezuelaVietnamWest IndiesWestern AfricaWestern AsiaWestern EuropeYemenZaireZimbabweAzores
South American Indian
Race
Ancestry
AfghanAfricanAlaska NativeAlaskan AthabascanAlbanianAleutAlsatianAmericanApacheArabArapahoArgentineanArmenianAssyrian/Chaldean/SyriacAustralianAustrianBahamianBangladeshiBarbadianBasqueBelgianBelizeanBermudanBhutaneseBlackfeetBolivianBrazilianBritishBritish West IndianBulgarianBurmeseCajunCambodianCanadianCape VerdeanCarpatho RusynCelticCentral AmericanCentral American IndianCherokeeCheyenneChickasawChileanChineseChippewaChoctawColombianColvilleComancheCosta RicanCreeCreekCroatianCrowCubanCypriotCzechCzechoslovakianDanishDelawareDominicanDutchDutch West IndianEastern EuropeanEcuadorianEgyptianEnglishEstonianEthiopianEuropeanFijianFilipinoFinnishFrenchFrench American IndianFrench CanadianGermanGerman RussianGhanaianGreekGuamanian/ChamorroGuatemalanGuyaneseHaitianHmongHonduranHopiHoumaHungarianIcelanderIndian (Asian)IndonesianInupiatIranianIraqiIrishIroquoisIsraeliItalianJamaicanJapaneseJordanianKenyanKiowaKoreanLaotianLatvianLebaneseLiberianLithuanianLumbeeLuxembourgerMacedonianMalaysianMalteseMarshalleseMenomineeMexicanMexican American IndianMongolianMoroccanNative HawaiianNavajoNepaleseNew ZealanderNicaraguanNigerianNorthern EuropeanNorwegianOkinawanOsageOttawaPaiutePakistaniPalestinianPanamanianParaguayanPennsylvania GermanPeruvianPimaPolishPortuguesePotawatomiPuebloPuerto RicanPuget Sound SalishRomanianRussianSalvadoranSamoanScandinavianScotch-IrishScottishSeminoleSenegaleseSerbianShoshoneSierra LeoneanSiouxSlavicSlovakSloveneSomaliSouth AfricanSouth AmericanSouth American IndianSoviet UnionSpaniardSpanishSpanish AmericanSpanish American IndianSri LankanSubsaharan AfricanSudaneseSwedishSwissSyrianTaiwaneseThaiTlingit-HaidaTohono O'OdhamTonganTrinidadian and TobagonianTsimshianTurkishU.S. Virgin IslanderUgandanUkrainianUruguayanUteVenezuelanVietnameseWelshWest IndianYakamaYaquiYugoslavianYumanYup'ikZimbabwean
Immigration
NonimmigrantsImmigrantsAfghanistanAfricaAlbaniaArgentinaArmeniaAsiaAustraliaAustriaBahamasBangladeshBarbadosBelarusBelgiumBelizeBoliviaBosnia and HerzegovinaBrazilBulgariaBurma/MyanmarCabo VerdeCambodiaCameroonCanadaCaribbeanCentral AmericaChileChinaColombiaCongoCosta RicaCroatiaCubaCzechoslovakiaDenmarkDominicaDominican RepublicEastern AfricaEastern AsiaEastern EuropeEcuadorEgyptEl SalvadorEnglandEritreaEthiopiaEuropeFijiFranceGermanyGhanaGreeceGrenadaGuatemalaGuyanaHaitiHondurasHong KongHungaryIndiaIndonesiaIranIraqIrelandIsraelItalyJamaicaJapanJordanKazakhstanKenyaKoreaKuwaitLaosLatin AmericaLatviaLebanonLiberiaLithuaniaMalaysiaMexicoMicronesiaMiddle AfricaMoldovaMoroccoNepalNicaraguaNigeriaNorth AmericaNorth MacedoniaNorthern AfricaNorthern EuropeNorwayOceaniaPakistanPanamaPeruPhilippinesPolandPortugalRomaniaRussiaSaudi ArabiaScotlandSenegalSerbiaSierra LeoneSingaporeSomaliaSouth AfricaSouth AmericaSouth Central AsiaSouth Eastern AsiaSouthern EuropeSpainSri LankaSt. Vincent and the GrenadinesSudanSwedenSwitzerlandSyriaTaiwanThailandTrinidad and TobagoTurkeyUgandaUkraineUruguayUzbekistanVenezuelaVietnamWest IndiesWestern AfricaWestern AsiaWestern EuropeYemenZaireZimbabweAzores
In Labor Force | Age > 16
Income
Poverty
Unemployment
Labor Participation
Family Structure
Vehicle Availability
Education Level
Disability

In Labor Force | Age > 16 Comparison

Immigrants from Netherlands

South American Indians

Tragic
Exceptional
64.5%
IN LABOR FORCE | AGE > 16
3.4/ 100
METRIC RATING
242nd/ 347
METRIC RANK
66.0%
IN LABOR FORCE | AGE > 16
99.4/ 100
METRIC RATING
87th/ 347
METRIC RANK

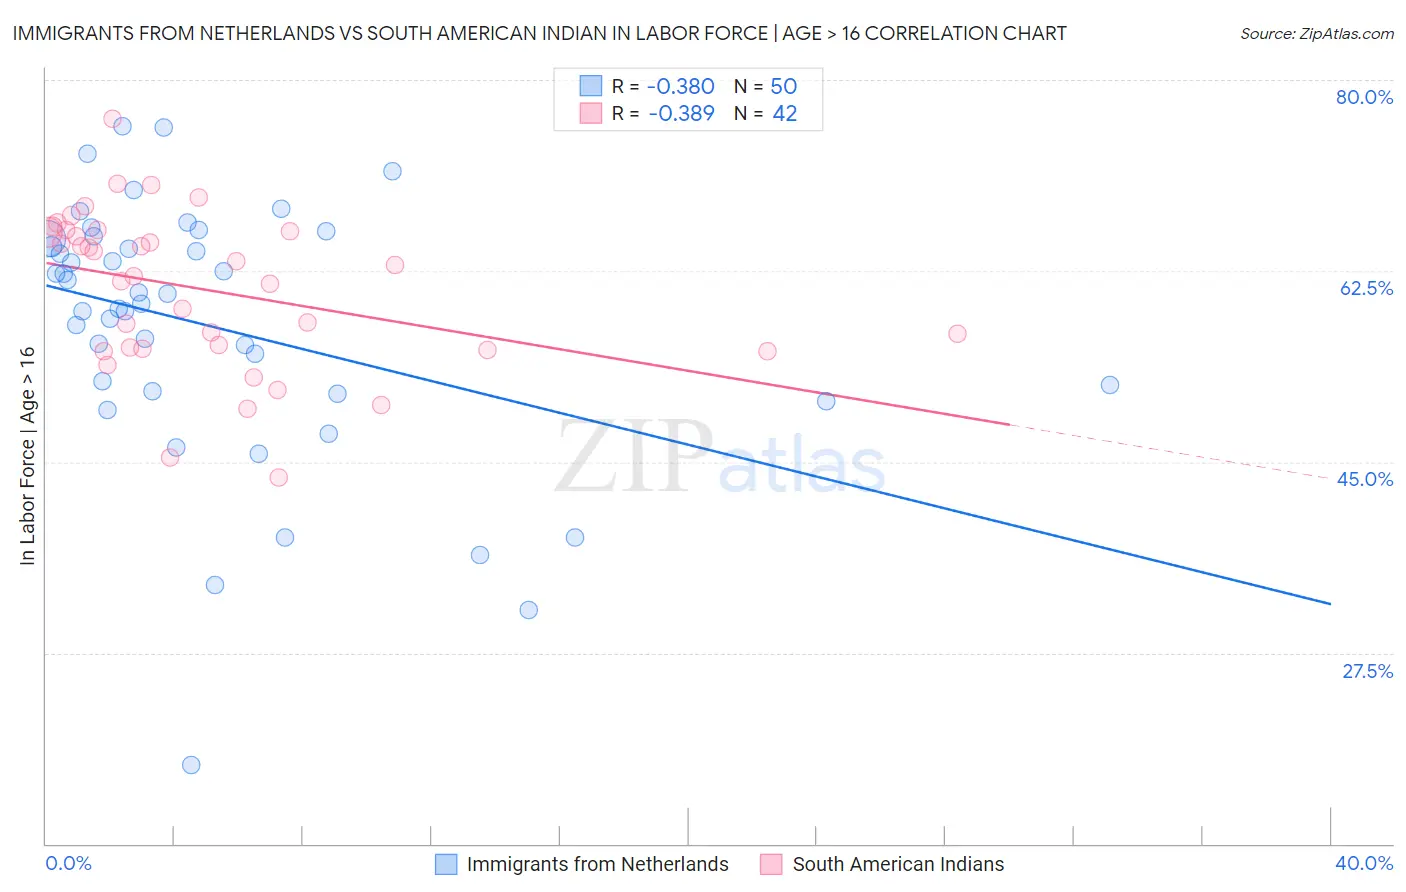
Immigrants from Netherlands vs South American Indian In Labor Force | Age > 16 Correlation Chart

The statistical analysis conducted on geographies consisting of 237,884,135 people shows a mild negative correlation between the proportion of Immigrants from Netherlands and labor force participation rate among population ages 16 and over in the United States with a correlation coefficient (R) of -0.380 and weighted average of 64.5%. Similarly, the statistical analysis conducted on geographies consisting of 164,562,228 people shows a mild negative correlation between the proportion of South American Indians and labor force participation rate among population ages 16 and over in the United States with a correlation coefficient (R) of -0.389 and weighted average of 66.0%, a difference of 2.4%.
Immigrants from Netherlands vs South American Indian In Labor Force | Age > 16

In Labor Force | Age > 16 Correlation Summary

MeasurementImmigrants from NetherlandsSouth American Indian
Minimum17.2%43.6%
Maximum75.8%76.5%
Range58.5%32.9%
Mean57.4%60.8%
Median60.0%62.6%
Interquartile 25% (IQ1)51.5%55.4%
Interquartile 75% (IQ3)65.4%66.1%
Interquartile Range (IQR)13.9%10.7%
Standard Deviation (Sample)11.9%7.2%
Standard Deviation (Population)11.8%7.1%

Similar Demographics by In Labor Force | Age > 16

Demographics Similar to Immigrants from Netherlands by In Labor Force | Age > 16

In terms of in labor force | age > 16, the demographic groups most similar to Immigrants from Netherlands are Immigrants from Dominica (64.5%, a difference of 0.010%), Immigrants from Lebanon (64.5%, a difference of 0.010%), Immigrants from Bangladesh (64.5%, a difference of 0.020%), Immigrants from Hungary (64.5%, a difference of 0.030%), and Tsimshian (64.5%, a difference of 0.030%).
DemographicsRating | RankIn Labor Force | Age > 16
Austrians
4.6
/100
|
#235
Tragic
64.6%
Immigrants | Norway
4.6
/100
|
#236
Tragic
64.6%
Italians
4.6
/100
|
#237
Tragic
64.6%
Lebanese
3.9
/100
|
#238
Tragic
64.5%
Immigrants | Hungary
3.8
/100
|
#239
Tragic
64.5%
Immigrants | Bangladesh
3.6
/100
|
#240
Tragic
64.5%
Immigrants | Dominica
3.5
/100
|
#241
Tragic
64.5%
Immigrants | Netherlands
3.4
/100
|
#242
Tragic
64.5%
Immigrants | Lebanon
3.2
/100
|
#243
Tragic
64.5%
Tsimshian
3.1
/100
|
#244
Tragic
64.5%
West Indians
3.0
/100
|
#245
Tragic
64.5%
Immigrants | Caribbean
2.3
/100
|
#246
Tragic
64.4%
Swiss
2.1
/100
|
#247
Tragic
64.4%
Immigrants | Barbados
2.1
/100
|
#248
Tragic
64.4%
Germans
1.8
/100
|
#249
Tragic
64.4%

Demographics Similar to South American Indians by In Labor Force | Age > 16

In terms of in labor force | age > 16, the demographic groups most similar to South American Indians are Bermudan (66.0%, a difference of 0.0%), South American (66.0%, a difference of 0.010%), Mongolian (66.1%, a difference of 0.020%), German Russian (66.1%, a difference of 0.040%), and Immigrants from Jordan (66.1%, a difference of 0.040%).
DemographicsRating | RankIn Labor Force | Age > 16
Malaysians
99.6
/100
|
#80
Exceptional
66.1%
Moroccans
99.5
/100
|
#81
Exceptional
66.1%
German Russians
99.4
/100
|
#82
Exceptional
66.1%
Immigrants | Jordan
99.4
/100
|
#83
Exceptional
66.1%
Central Americans
99.4
/100
|
#84
Exceptional
66.1%
Mongolians
99.4
/100
|
#85
Exceptional
66.1%
South Americans
99.4
/100
|
#86
Exceptional
66.0%
South American Indians
99.4
/100
|
#87
Exceptional
66.0%
Bermudans
99.3
/100
|
#88
Exceptional
66.0%
Immigrants | Laos
99.2
/100
|
#89
Exceptional
66.0%
Chileans
99.2
/100
|
#90
Exceptional
66.0%
Iranians
99.2
/100
|
#91
Exceptional
66.0%
Aleuts
99.1
/100
|
#92
Exceptional
66.0%
Immigrants | South America
99.1
/100
|
#93
Exceptional
66.0%
Immigrants | Cambodia
99.1
/100
|
#94
Exceptional
66.0%