Argentinean vs Immigrants from Germany In Labor Force | Age > 16
COMPARE
Argentinean
Immigrants from Germany
In Labor Force | Age > 16
In Labor Force | Age > 16 Comparison
Argentineans
Immigrants from Germany
65.7%
IN LABOR FORCE | AGE > 16
96.7/ 100
METRIC RATING
116th/ 347
METRIC RANK
63.9%
IN LABOR FORCE | AGE > 16
0.1/ 100
METRIC RATING
283rd/ 347
METRIC RANK
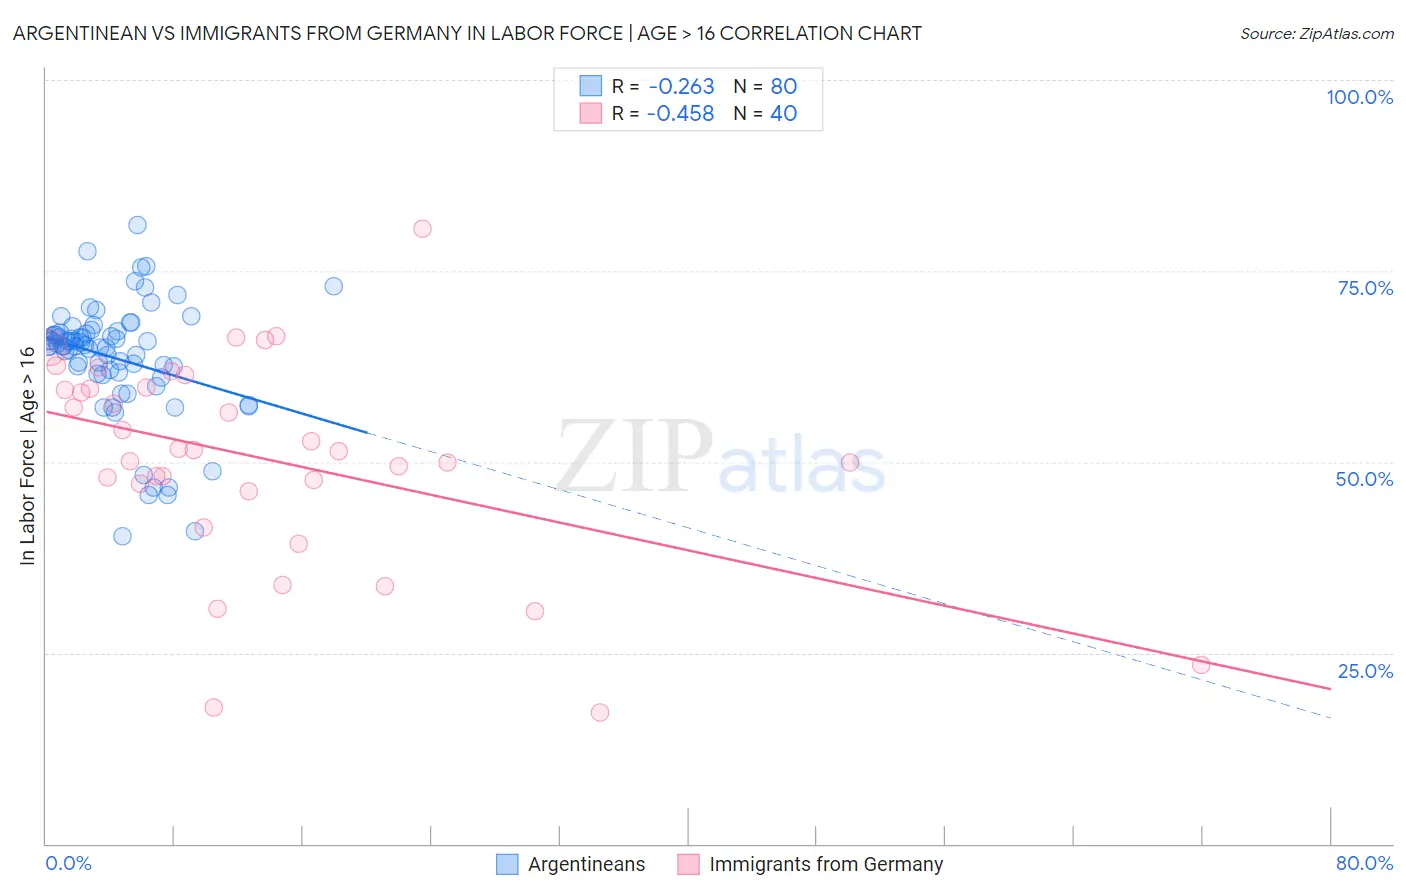
Argentinean vs Immigrants from Germany In Labor Force | Age > 16 Correlation Chart
The statistical analysis conducted on geographies consisting of 297,149,782 people shows a weak negative correlation between the proportion of Argentineans and labor force participation rate among population ages 16 and over in the United States with a correlation coefficient (R) of -0.263 and weighted average of 65.7%. Similarly, the statistical analysis conducted on geographies consisting of 463,889,026 people shows a moderate negative correlation between the proportion of Immigrants from Germany and labor force participation rate among population ages 16 and over in the United States with a correlation coefficient (R) of -0.458 and weighted average of 63.9%, a difference of 2.8%.
In Labor Force | Age > 16 Correlation Summary
| Measurement | Argentinean | Immigrants from Germany |
| Minimum | 40.3% | 17.2% |
| Maximum | 81.0% | 80.6% |
| Range | 40.7% | 63.4% |
| Mean | 63.6% | 50.4% |
| Median | 65.3% | 51.5% |
| Interquartile 25% (IQ1) | 61.7% | 46.7% |
| Interquartile 75% (IQ3) | 66.9% | 59.7% |
| Interquartile Range (IQR) | 5.2% | 13.0% |
| Standard Deviation (Sample) | 7.7% | 13.8% |
| Standard Deviation (Population) | 7.6% | 13.6% |
Similar Demographics by In Labor Force | Age > 16
Demographics Similar to Argentineans by In Labor Force | Age > 16
In terms of in labor force | age > 16, the demographic groups most similar to Argentineans are Immigrants from Indonesia (65.7%, a difference of 0.010%), Immigrants from Iran (65.7%, a difference of 0.010%), Immigrants from Thailand (65.7%, a difference of 0.010%), Immigrants from France (65.7%, a difference of 0.020%), and Pakistani (65.8%, a difference of 0.040%).
| Demographics | Rating | Rank | In Labor Force | Age > 16 |
| Immigrants | Japan | 98.0 /100 | #109 | Exceptional 65.8% |
| Japanese | 97.7 /100 | #110 | Exceptional 65.8% |
| Immigrants | Honduras | 97.5 /100 | #111 | Exceptional 65.8% |
| Laotians | 97.4 /100 | #112 | Exceptional 65.8% |
| Pakistanis | 97.1 /100 | #113 | Exceptional 65.8% |
| Hondurans | 97.1 /100 | #114 | Exceptional 65.8% |
| Immigrants | Indonesia | 96.8 /100 | #115 | Exceptional 65.7% |
| Argentineans | 96.7 /100 | #116 | Exceptional 65.7% |
| Immigrants | Iran | 96.6 /100 | #117 | Exceptional 65.7% |
| Immigrants | Thailand | 96.6 /100 | #118 | Exceptional 65.7% |
| Immigrants | France | 96.4 /100 | #119 | Exceptional 65.7% |
| Immigrants | Hong Kong | 96.2 /100 | #120 | Exceptional 65.7% |
| New Zealanders | 96.0 /100 | #121 | Exceptional 65.7% |
| Immigrants | Ecuador | 95.9 /100 | #122 | Exceptional 65.7% |
| Immigrants | Iraq | 95.5 /100 | #123 | Exceptional 65.7% |
Demographics Similar to Immigrants from Germany by In Labor Force | Age > 16
In terms of in labor force | age > 16, the demographic groups most similar to Immigrants from Germany are French (63.9%, a difference of 0.010%), Immigrants from Guyana (64.0%, a difference of 0.040%), Slovak (63.9%, a difference of 0.040%), Immigrants from Austria (63.9%, a difference of 0.070%), and Scottish (63.9%, a difference of 0.070%).
| Demographics | Rating | Rank | In Labor Force | Age > 16 |
| French American Indians | 0.3 /100 | #276 | Tragic 64.1% |
| Immigrants | Bahamas | 0.3 /100 | #277 | Tragic 64.0% |
| Assyrians/Chaldeans/Syriacs | 0.3 /100 | #278 | Tragic 64.0% |
| Welsh | 0.2 /100 | #279 | Tragic 64.0% |
| Immigrants | St. Vincent and the Grenadines | 0.2 /100 | #280 | Tragic 64.0% |
| French Canadians | 0.2 /100 | #281 | Tragic 64.0% |
| Immigrants | Guyana | 0.2 /100 | #282 | Tragic 64.0% |
| Immigrants | Germany | 0.1 /100 | #283 | Tragic 63.9% |
| French | 0.1 /100 | #284 | Tragic 63.9% |
| Slovaks | 0.1 /100 | #285 | Tragic 63.9% |
| Immigrants | Austria | 0.1 /100 | #286 | Tragic 63.9% |
| Scottish | 0.1 /100 | #287 | Tragic 63.9% |
| Spanish | 0.1 /100 | #288 | Tragic 63.9% |
| Celtics | 0.1 /100 | #289 | Tragic 63.8% |
| Hungarians | 0.1 /100 | #290 | Tragic 63.8% |