Argentinean vs Venezuelan In Labor Force | Age > 16
COMPARE
Argentinean
Venezuelan
In Labor Force | Age > 16
In Labor Force | Age > 16 Comparison
Argentineans
Venezuelans
65.7%
IN LABOR FORCE | AGE > 16
96.7/ 100
METRIC RATING
116th/ 347
METRIC RANK
66.3%
IN LABOR FORCE | AGE > 16
99.8/ 100
METRIC RATING
63rd/ 347
METRIC RANK
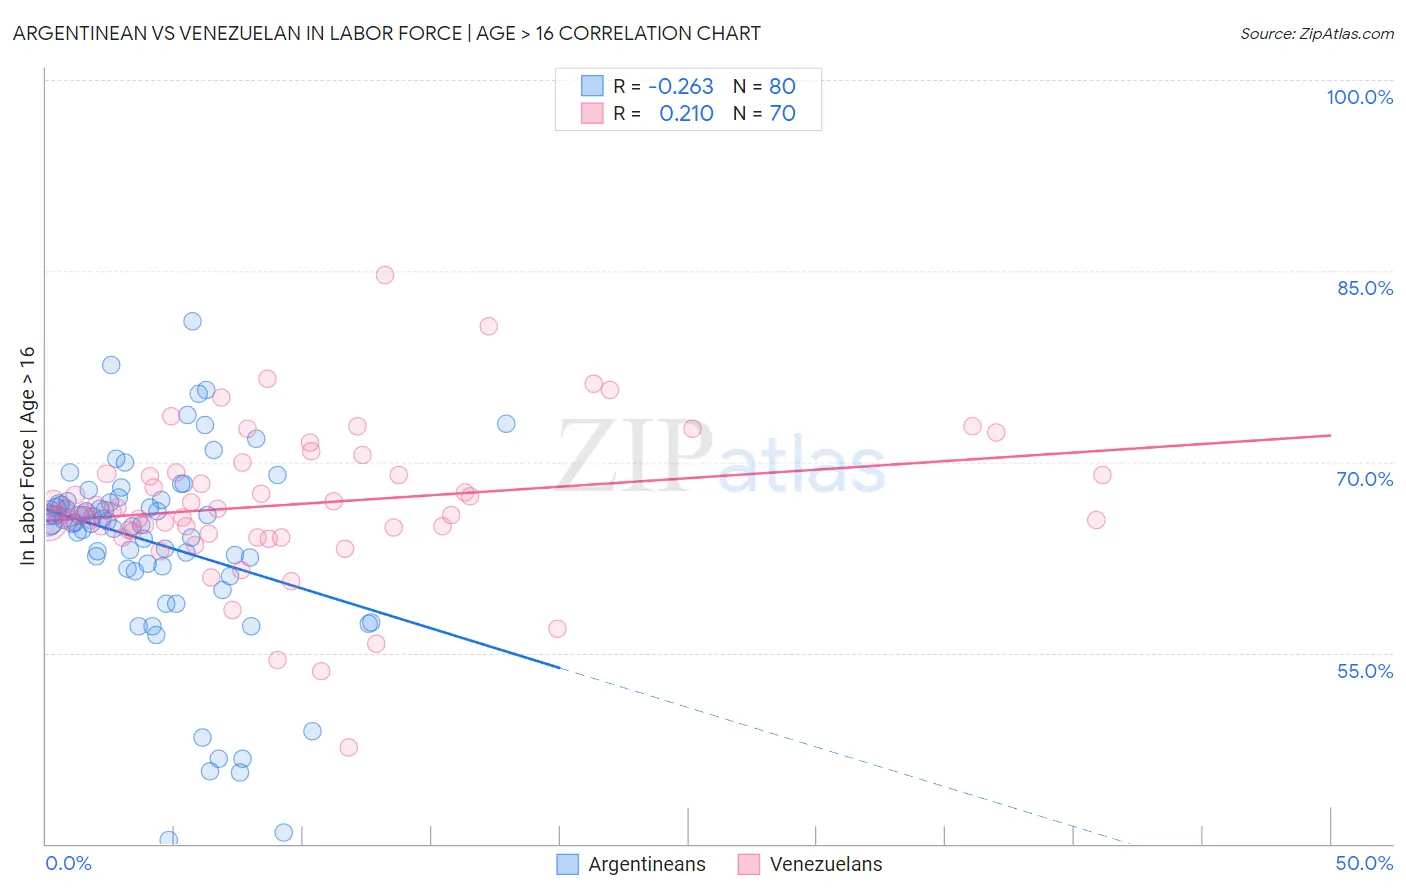
Argentinean vs Venezuelan In Labor Force | Age > 16 Correlation Chart
The statistical analysis conducted on geographies consisting of 297,149,782 people shows a weak negative correlation between the proportion of Argentineans and labor force participation rate among population ages 16 and over in the United States with a correlation coefficient (R) of -0.263 and weighted average of 65.7%. Similarly, the statistical analysis conducted on geographies consisting of 306,338,840 people shows a weak positive correlation between the proportion of Venezuelans and labor force participation rate among population ages 16 and over in the United States with a correlation coefficient (R) of 0.210 and weighted average of 66.3%, a difference of 0.82%.
In Labor Force | Age > 16 Correlation Summary
| Measurement | Argentinean | Venezuelan |
| Minimum | 40.3% | 47.6% |
| Maximum | 81.0% | 84.7% |
| Range | 40.7% | 37.1% |
| Mean | 63.6% | 66.7% |
| Median | 65.3% | 66.1% |
| Interquartile 25% (IQ1) | 61.7% | 64.6% |
| Interquartile 75% (IQ3) | 66.9% | 69.1% |
| Interquartile Range (IQR) | 5.2% | 4.5% |
| Standard Deviation (Sample) | 7.7% | 5.8% |
| Standard Deviation (Population) | 7.6% | 5.8% |
Similar Demographics by In Labor Force | Age > 16
Demographics Similar to Argentineans by In Labor Force | Age > 16
In terms of in labor force | age > 16, the demographic groups most similar to Argentineans are Immigrants from Indonesia (65.7%, a difference of 0.010%), Immigrants from Iran (65.7%, a difference of 0.010%), Immigrants from Thailand (65.7%, a difference of 0.010%), Immigrants from France (65.7%, a difference of 0.020%), and Pakistani (65.8%, a difference of 0.040%).
| Demographics | Rating | Rank | In Labor Force | Age > 16 |
| Immigrants | Japan | 98.0 /100 | #109 | Exceptional 65.8% |
| Japanese | 97.7 /100 | #110 | Exceptional 65.8% |
| Immigrants | Honduras | 97.5 /100 | #111 | Exceptional 65.8% |
| Laotians | 97.4 /100 | #112 | Exceptional 65.8% |
| Pakistanis | 97.1 /100 | #113 | Exceptional 65.8% |
| Hondurans | 97.1 /100 | #114 | Exceptional 65.8% |
| Immigrants | Indonesia | 96.8 /100 | #115 | Exceptional 65.7% |
| Argentineans | 96.7 /100 | #116 | Exceptional 65.7% |
| Immigrants | Iran | 96.6 /100 | #117 | Exceptional 65.7% |
| Immigrants | Thailand | 96.6 /100 | #118 | Exceptional 65.7% |
| Immigrants | France | 96.4 /100 | #119 | Exceptional 65.7% |
| Immigrants | Hong Kong | 96.2 /100 | #120 | Exceptional 65.7% |
| New Zealanders | 96.0 /100 | #121 | Exceptional 65.7% |
| Immigrants | Ecuador | 95.9 /100 | #122 | Exceptional 65.7% |
| Immigrants | Iraq | 95.5 /100 | #123 | Exceptional 65.7% |
Demographics Similar to Venezuelans by In Labor Force | Age > 16
In terms of in labor force | age > 16, the demographic groups most similar to Venezuelans are Peruvian (66.3%, a difference of 0.0%), Sri Lankan (66.3%, a difference of 0.010%), Jordanian (66.3%, a difference of 0.030%), Immigrants from Peru (66.3%, a difference of 0.040%), and Immigrants from Burma/Myanmar (66.3%, a difference of 0.040%).
| Demographics | Rating | Rank | In Labor Force | Age > 16 |
| Immigrants | Senegal | 99.9 /100 | #56 | Exceptional 66.4% |
| Bulgarians | 99.9 /100 | #57 | Exceptional 66.4% |
| Immigrants | Saudi Arabia | 99.9 /100 | #58 | Exceptional 66.3% |
| Immigrants | Turkey | 99.9 /100 | #59 | Exceptional 66.3% |
| Immigrants | Peru | 99.8 /100 | #60 | Exceptional 66.3% |
| Immigrants | Burma/Myanmar | 99.8 /100 | #61 | Exceptional 66.3% |
| Indonesians | 99.8 /100 | #62 | Exceptional 66.3% |
| Venezuelans | 99.8 /100 | #63 | Exceptional 66.3% |
| Peruvians | 99.8 /100 | #64 | Exceptional 66.3% |
| Sri Lankans | 99.8 /100 | #65 | Exceptional 66.3% |
| Jordanians | 99.8 /100 | #66 | Exceptional 66.3% |
| Egyptians | 99.8 /100 | #67 | Exceptional 66.2% |
| Immigrants | Egypt | 99.7 /100 | #68 | Exceptional 66.2% |
| Sub-Saharan Africans | 99.7 /100 | #69 | Exceptional 66.2% |
| Asians | 99.7 /100 | #70 | Exceptional 66.2% |