Immigrants from Ghana vs South American Indian In Labor Force | Age > 16
COMPARE
Immigrants from Ghana
South American Indian
In Labor Force | Age > 16
In Labor Force | Age > 16 Comparison
Immigrants from Ghana
South American Indians
67.1%
IN LABOR FORCE | AGE > 16
100.0/ 100
METRIC RATING
34th/ 347
METRIC RANK
66.0%
IN LABOR FORCE | AGE > 16
99.4/ 100
METRIC RATING
87th/ 347
METRIC RANK
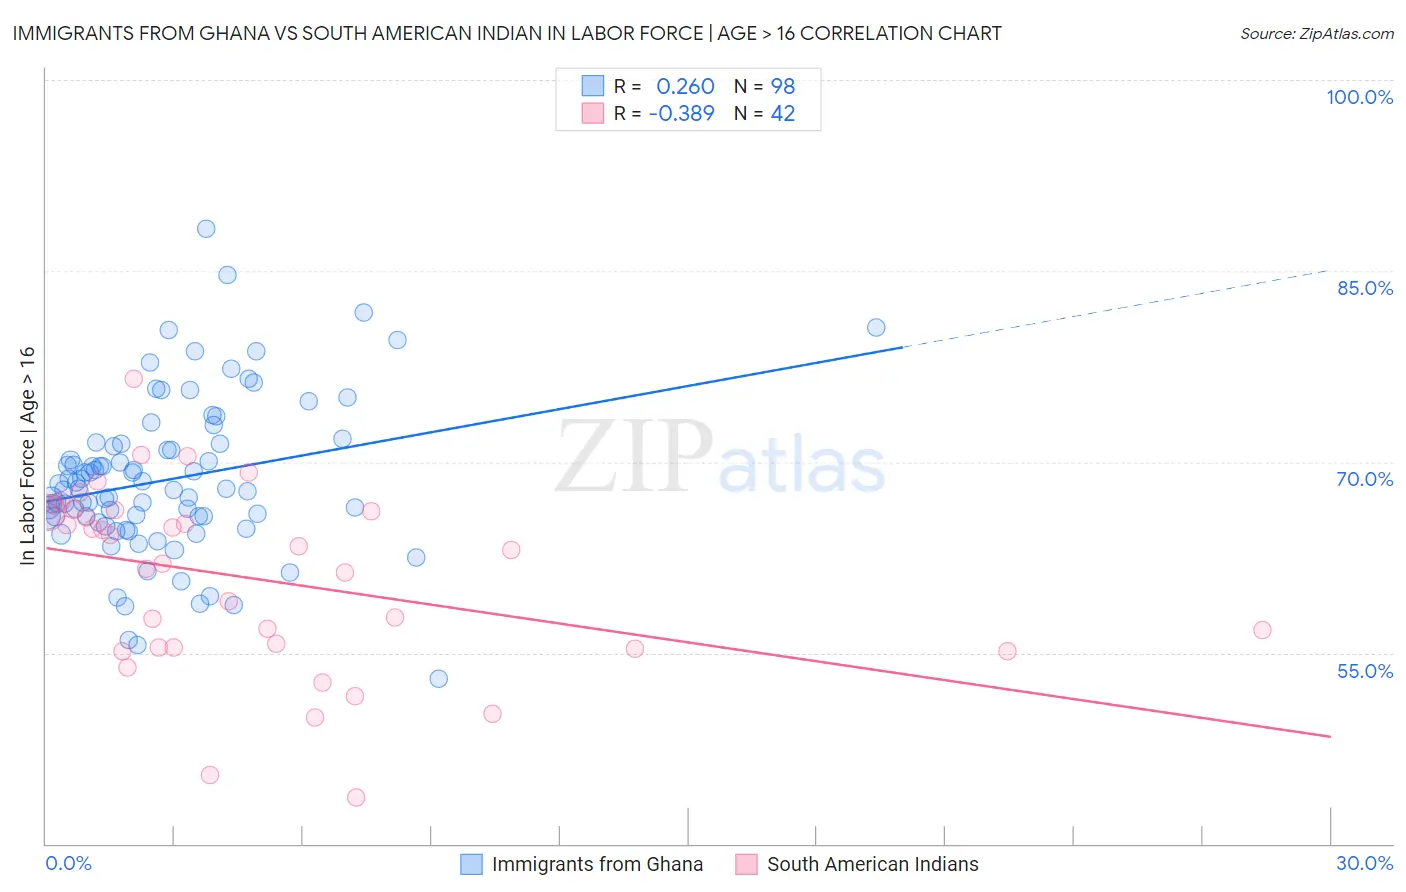
Immigrants from Ghana vs South American Indian In Labor Force | Age > 16 Correlation Chart
The statistical analysis conducted on geographies consisting of 199,965,359 people shows a weak positive correlation between the proportion of Immigrants from Ghana and labor force participation rate among population ages 16 and over in the United States with a correlation coefficient (R) of 0.260 and weighted average of 67.1%. Similarly, the statistical analysis conducted on geographies consisting of 164,562,228 people shows a mild negative correlation between the proportion of South American Indians and labor force participation rate among population ages 16 and over in the United States with a correlation coefficient (R) of -0.389 and weighted average of 66.0%, a difference of 1.6%.
In Labor Force | Age > 16 Correlation Summary
| Measurement | Immigrants from Ghana | South American Indian |
| Minimum | 53.0% | 43.6% |
| Maximum | 88.3% | 76.5% |
| Range | 35.3% | 32.9% |
| Mean | 68.6% | 60.8% |
| Median | 67.9% | 62.6% |
| Interquartile 25% (IQ1) | 65.7% | 55.4% |
| Interquartile 75% (IQ3) | 71.4% | 66.1% |
| Interquartile Range (IQR) | 5.7% | 10.7% |
| Standard Deviation (Sample) | 6.2% | 7.2% |
| Standard Deviation (Population) | 6.1% | 7.1% |
Similar Demographics by In Labor Force | Age > 16
Demographics Similar to Immigrants from Ghana by In Labor Force | Age > 16
In terms of in labor force | age > 16, the demographic groups most similar to Immigrants from Ghana are Afghan (67.1%, a difference of 0.010%), Immigrants from Congo (67.1%, a difference of 0.020%), Immigrants from South Central Asia (67.1%, a difference of 0.050%), Immigrants from Western Africa (67.1%, a difference of 0.050%), and Ghanaian (67.1%, a difference of 0.070%).
| Demographics | Rating | Rank | In Labor Force | Age > 16 |
| Zimbabweans | 100.0 /100 | #27 | Exceptional 67.3% |
| Immigrants | Morocco | 100.0 /100 | #28 | Exceptional 67.2% |
| Thais | 100.0 /100 | #29 | Exceptional 67.2% |
| Immigrants | Zaire | 100.0 /100 | #30 | Exceptional 67.2% |
| Ghanaians | 100.0 /100 | #31 | Exceptional 67.1% |
| Immigrants | Congo | 100.0 /100 | #32 | Exceptional 67.1% |
| Afghans | 100.0 /100 | #33 | Exceptional 67.1% |
| Immigrants | Ghana | 100.0 /100 | #34 | Exceptional 67.1% |
| Immigrants | South Central Asia | 100.0 /100 | #35 | Exceptional 67.1% |
| Immigrants | Western Africa | 100.0 /100 | #36 | Exceptional 67.1% |
| Immigrants | Afghanistan | 100.0 /100 | #37 | Exceptional 67.0% |
| Immigrants | Nigeria | 100.0 /100 | #38 | Exceptional 66.9% |
| Salvadorans | 100.0 /100 | #39 | Exceptional 66.8% |
| Immigrants | El Salvador | 100.0 /100 | #40 | Exceptional 66.8% |
| Immigrants | Zimbabwe | 100.0 /100 | #41 | Exceptional 66.8% |
Demographics Similar to South American Indians by In Labor Force | Age > 16
In terms of in labor force | age > 16, the demographic groups most similar to South American Indians are Bermudan (66.0%, a difference of 0.0%), South American (66.0%, a difference of 0.010%), Mongolian (66.1%, a difference of 0.020%), German Russian (66.1%, a difference of 0.040%), and Immigrants from Jordan (66.1%, a difference of 0.040%).
| Demographics | Rating | Rank | In Labor Force | Age > 16 |
| Malaysians | 99.6 /100 | #80 | Exceptional 66.1% |
| Moroccans | 99.5 /100 | #81 | Exceptional 66.1% |
| German Russians | 99.4 /100 | #82 | Exceptional 66.1% |
| Immigrants | Jordan | 99.4 /100 | #83 | Exceptional 66.1% |
| Central Americans | 99.4 /100 | #84 | Exceptional 66.1% |
| Mongolians | 99.4 /100 | #85 | Exceptional 66.1% |
| South Americans | 99.4 /100 | #86 | Exceptional 66.0% |
| South American Indians | 99.4 /100 | #87 | Exceptional 66.0% |
| Bermudans | 99.3 /100 | #88 | Exceptional 66.0% |
| Immigrants | Laos | 99.2 /100 | #89 | Exceptional 66.0% |
| Chileans | 99.2 /100 | #90 | Exceptional 66.0% |
| Iranians | 99.2 /100 | #91 | Exceptional 66.0% |
| Aleuts | 99.1 /100 | #92 | Exceptional 66.0% |
| Immigrants | South America | 99.1 /100 | #93 | Exceptional 66.0% |
| Immigrants | Cambodia | 99.1 /100 | #94 | Exceptional 66.0% |