Dutch vs South American Indian In Labor Force | Age > 16
COMPARE
Dutch
South American Indian
In Labor Force | Age > 16
In Labor Force | Age > 16 Comparison
Dutch
South American Indians
64.2%
IN LABOR FORCE | AGE > 16
0.6/ 100
METRIC RATING
264th/ 347
METRIC RANK
66.0%
IN LABOR FORCE | AGE > 16
99.4/ 100
METRIC RATING
87th/ 347
METRIC RANK
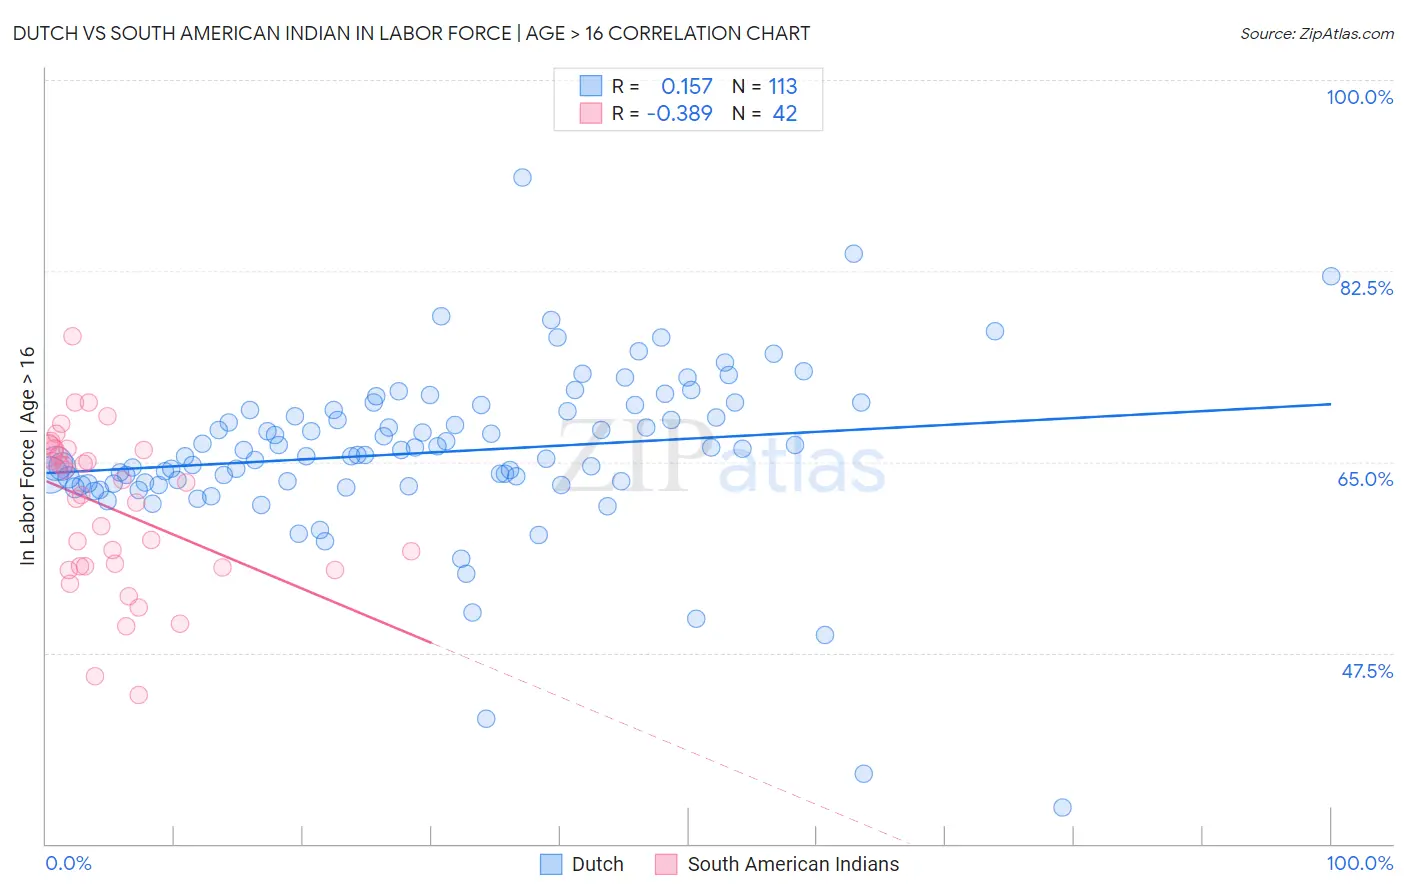
Dutch vs South American Indian In Labor Force | Age > 16 Correlation Chart
The statistical analysis conducted on geographies consisting of 554,365,938 people shows a poor positive correlation between the proportion of Dutch and labor force participation rate among population ages 16 and over in the United States with a correlation coefficient (R) of 0.157 and weighted average of 64.2%. Similarly, the statistical analysis conducted on geographies consisting of 164,562,228 people shows a mild negative correlation between the proportion of South American Indians and labor force participation rate among population ages 16 and over in the United States with a correlation coefficient (R) of -0.389 and weighted average of 66.0%, a difference of 2.9%.
In Labor Force | Age > 16 Correlation Summary
| Measurement | Dutch | South American Indian |
| Minimum | 33.3% | 43.6% |
| Maximum | 91.1% | 76.5% |
| Range | 57.8% | 32.9% |
| Mean | 65.9% | 60.8% |
| Median | 65.6% | 62.6% |
| Interquartile 25% (IQ1) | 63.0% | 55.4% |
| Interquartile 75% (IQ3) | 69.8% | 66.1% |
| Interquartile Range (IQR) | 6.7% | 10.7% |
| Standard Deviation (Sample) | 7.8% | 7.2% |
| Standard Deviation (Population) | 7.8% | 7.1% |
Similar Demographics by In Labor Force | Age > 16
Demographics Similar to Dutch by In Labor Force | Age > 16
In terms of in labor force | age > 16, the demographic groups most similar to Dutch are Bahamian (64.2%, a difference of 0.020%), Finnish (64.2%, a difference of 0.030%), Cuban (64.2%, a difference of 0.040%), Immigrants from Western Europe (64.2%, a difference of 0.050%), and Marshallese (64.2%, a difference of 0.050%).
| Demographics | Rating | Rank | In Labor Force | Age > 16 |
| Inupiat | 0.8 /100 | #257 | Tragic 64.3% |
| Immigrants | Scotland | 0.8 /100 | #258 | Tragic 64.2% |
| Immigrants | Western Europe | 0.7 /100 | #259 | Tragic 64.2% |
| Marshallese | 0.7 /100 | #260 | Tragic 64.2% |
| Basques | 0.7 /100 | #261 | Tragic 64.2% |
| Finns | 0.7 /100 | #262 | Tragic 64.2% |
| Bahamians | 0.6 /100 | #263 | Tragic 64.2% |
| Dutch | 0.6 /100 | #264 | Tragic 64.2% |
| Cubans | 0.5 /100 | #265 | Tragic 64.2% |
| Immigrants | England | 0.5 /100 | #266 | Tragic 64.2% |
| Canadians | 0.5 /100 | #267 | Tragic 64.1% |
| Spaniards | 0.5 /100 | #268 | Tragic 64.1% |
| Irish | 0.4 /100 | #269 | Tragic 64.1% |
| Guyanese | 0.4 /100 | #270 | Tragic 64.1% |
| Dominicans | 0.4 /100 | #271 | Tragic 64.1% |
Demographics Similar to South American Indians by In Labor Force | Age > 16
In terms of in labor force | age > 16, the demographic groups most similar to South American Indians are Bermudan (66.0%, a difference of 0.0%), South American (66.0%, a difference of 0.010%), Mongolian (66.1%, a difference of 0.020%), German Russian (66.1%, a difference of 0.040%), and Immigrants from Jordan (66.1%, a difference of 0.040%).
| Demographics | Rating | Rank | In Labor Force | Age > 16 |
| Malaysians | 99.6 /100 | #80 | Exceptional 66.1% |
| Moroccans | 99.5 /100 | #81 | Exceptional 66.1% |
| German Russians | 99.4 /100 | #82 | Exceptional 66.1% |
| Immigrants | Jordan | 99.4 /100 | #83 | Exceptional 66.1% |
| Central Americans | 99.4 /100 | #84 | Exceptional 66.1% |
| Mongolians | 99.4 /100 | #85 | Exceptional 66.1% |
| South Americans | 99.4 /100 | #86 | Exceptional 66.0% |
| South American Indians | 99.4 /100 | #87 | Exceptional 66.0% |
| Bermudans | 99.3 /100 | #88 | Exceptional 66.0% |
| Immigrants | Laos | 99.2 /100 | #89 | Exceptional 66.0% |
| Chileans | 99.2 /100 | #90 | Exceptional 66.0% |
| Iranians | 99.2 /100 | #91 | Exceptional 66.0% |
| Aleuts | 99.1 /100 | #92 | Exceptional 66.0% |
| Immigrants | South America | 99.1 /100 | #93 | Exceptional 66.0% |
| Immigrants | Cambodia | 99.1 /100 | #94 | Exceptional 66.0% |