Immigrants from Middle Africa vs South American Indian In Labor Force | Age > 16
COMPARE
Immigrants from Middle Africa
South American Indian
In Labor Force | Age > 16
In Labor Force | Age > 16 Comparison
Immigrants from Middle Africa
South American Indians
67.7%
IN LABOR FORCE | AGE > 16
100.0/ 100
METRIC RATING
15th/ 347
METRIC RANK
66.0%
IN LABOR FORCE | AGE > 16
99.4/ 100
METRIC RATING
87th/ 347
METRIC RANK
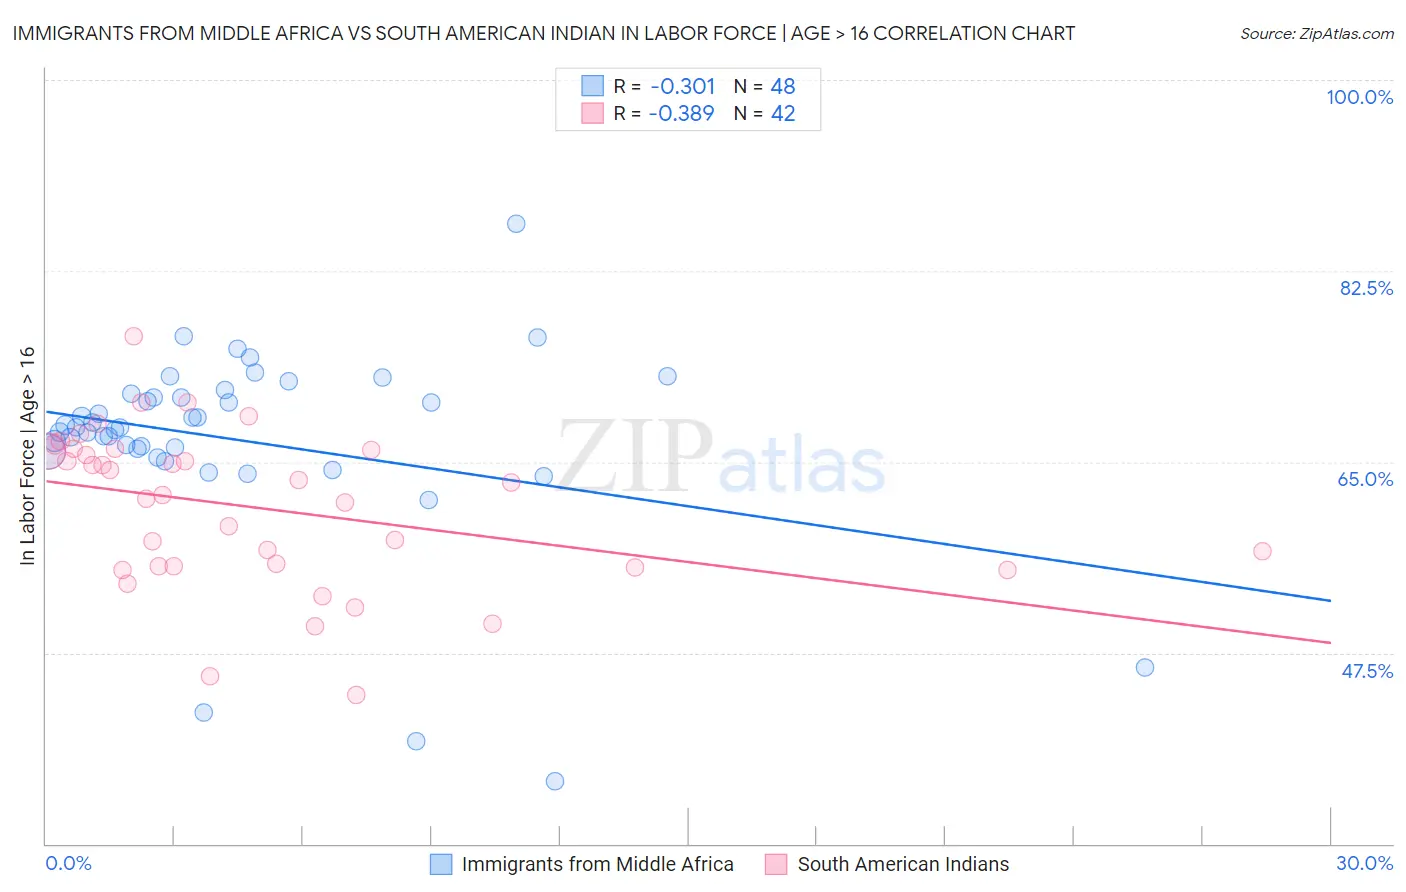
Immigrants from Middle Africa vs South American Indian In Labor Force | Age > 16 Correlation Chart
The statistical analysis conducted on geographies consisting of 202,740,845 people shows a mild negative correlation between the proportion of Immigrants from Middle Africa and labor force participation rate among population ages 16 and over in the United States with a correlation coefficient (R) of -0.301 and weighted average of 67.7%. Similarly, the statistical analysis conducted on geographies consisting of 164,562,228 people shows a mild negative correlation between the proportion of South American Indians and labor force participation rate among population ages 16 and over in the United States with a correlation coefficient (R) of -0.389 and weighted average of 66.0%, a difference of 2.6%.
In Labor Force | Age > 16 Correlation Summary
| Measurement | Immigrants from Middle Africa | South American Indian |
| Minimum | 35.7% | 43.6% |
| Maximum | 86.8% | 76.5% |
| Range | 51.1% | 32.9% |
| Mean | 67.0% | 60.8% |
| Median | 68.2% | 62.6% |
| Interquartile 25% (IQ1) | 66.1% | 55.4% |
| Interquartile 75% (IQ3) | 71.1% | 66.1% |
| Interquartile Range (IQR) | 5.0% | 10.7% |
| Standard Deviation (Sample) | 9.1% | 7.2% |
| Standard Deviation (Population) | 9.0% | 7.1% |
Similar Demographics by In Labor Force | Age > 16
Demographics Similar to Immigrants from Middle Africa by In Labor Force | Age > 16
In terms of in labor force | age > 16, the demographic groups most similar to Immigrants from Middle Africa are Liberian (67.8%, a difference of 0.050%), Immigrants from Sudan (67.7%, a difference of 0.11%), Immigrants from India (67.6%, a difference of 0.18%), Immigrants from Liberia (67.6%, a difference of 0.20%), and Kenyan (67.6%, a difference of 0.24%).
| Demographics | Rating | Rank | In Labor Force | Age > 16 |
| Immigrants | Sierra Leone | 100.0 /100 | #8 | Exceptional 68.5% |
| Immigrants | Eastern Africa | 100.0 /100 | #9 | Exceptional 68.5% |
| Immigrants | Bolivia | 100.0 /100 | #10 | Exceptional 68.4% |
| Bolivians | 100.0 /100 | #11 | Exceptional 68.2% |
| Sudanese | 100.0 /100 | #12 | Exceptional 68.0% |
| Immigrants | Nepal | 100.0 /100 | #13 | Exceptional 68.0% |
| Liberians | 100.0 /100 | #14 | Exceptional 67.8% |
| Immigrants | Middle Africa | 100.0 /100 | #15 | Exceptional 67.7% |
| Immigrants | Sudan | 100.0 /100 | #16 | Exceptional 67.7% |
| Immigrants | India | 100.0 /100 | #17 | Exceptional 67.6% |
| Immigrants | Liberia | 100.0 /100 | #18 | Exceptional 67.6% |
| Kenyans | 100.0 /100 | #19 | Exceptional 67.6% |
| Immigrants | Kenya | 100.0 /100 | #20 | Exceptional 67.6% |
| Tongans | 100.0 /100 | #21 | Exceptional 67.5% |
| Immigrants | Uganda | 100.0 /100 | #22 | Exceptional 67.5% |
Demographics Similar to South American Indians by In Labor Force | Age > 16
In terms of in labor force | age > 16, the demographic groups most similar to South American Indians are Bermudan (66.0%, a difference of 0.0%), South American (66.0%, a difference of 0.010%), Mongolian (66.1%, a difference of 0.020%), German Russian (66.1%, a difference of 0.040%), and Immigrants from Jordan (66.1%, a difference of 0.040%).
| Demographics | Rating | Rank | In Labor Force | Age > 16 |
| Malaysians | 99.6 /100 | #80 | Exceptional 66.1% |
| Moroccans | 99.5 /100 | #81 | Exceptional 66.1% |
| German Russians | 99.4 /100 | #82 | Exceptional 66.1% |
| Immigrants | Jordan | 99.4 /100 | #83 | Exceptional 66.1% |
| Central Americans | 99.4 /100 | #84 | Exceptional 66.1% |
| Mongolians | 99.4 /100 | #85 | Exceptional 66.1% |
| South Americans | 99.4 /100 | #86 | Exceptional 66.0% |
| South American Indians | 99.4 /100 | #87 | Exceptional 66.0% |
| Bermudans | 99.3 /100 | #88 | Exceptional 66.0% |
| Immigrants | Laos | 99.2 /100 | #89 | Exceptional 66.0% |
| Chileans | 99.2 /100 | #90 | Exceptional 66.0% |
| Iranians | 99.2 /100 | #91 | Exceptional 66.0% |
| Aleuts | 99.1 /100 | #92 | Exceptional 66.0% |
| Immigrants | South America | 99.1 /100 | #93 | Exceptional 66.0% |
| Immigrants | Cambodia | 99.1 /100 | #94 | Exceptional 66.0% |