Cherokee vs South American Indian In Labor Force | Age > 16
COMPARE
Cherokee
South American Indian
In Labor Force | Age > 16
In Labor Force | Age > 16 Comparison
Cherokee
South American Indians
61.9%
IN LABOR FORCE | AGE > 16
0.0/ 100
METRIC RATING
325th/ 347
METRIC RANK
66.0%
IN LABOR FORCE | AGE > 16
99.4/ 100
METRIC RATING
87th/ 347
METRIC RANK
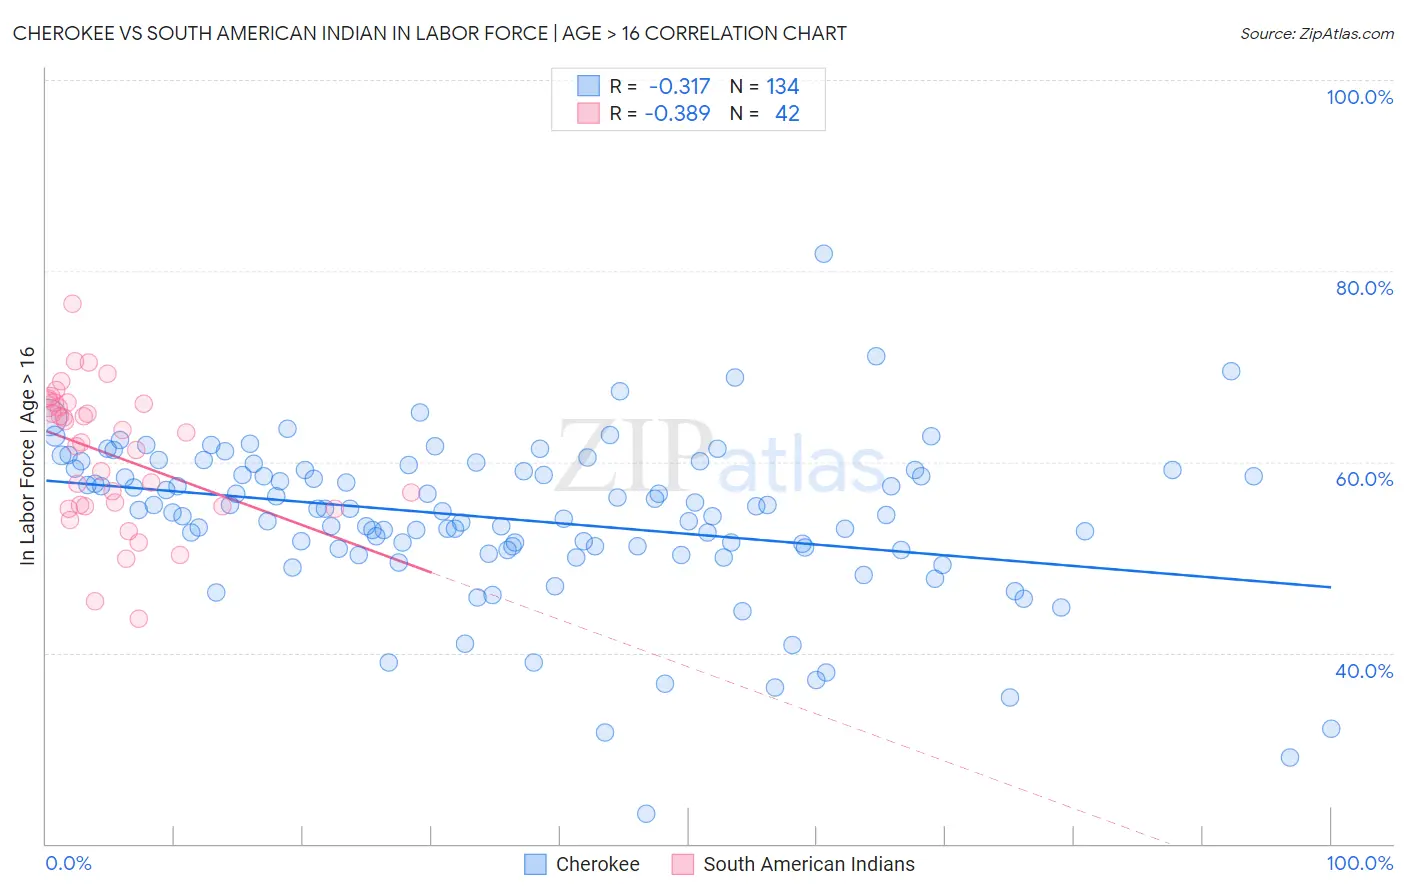
Cherokee vs South American Indian In Labor Force | Age > 16 Correlation Chart
The statistical analysis conducted on geographies consisting of 493,683,213 people shows a mild negative correlation between the proportion of Cherokee and labor force participation rate among population ages 16 and over in the United States with a correlation coefficient (R) of -0.317 and weighted average of 61.9%. Similarly, the statistical analysis conducted on geographies consisting of 164,562,228 people shows a mild negative correlation between the proportion of South American Indians and labor force participation rate among population ages 16 and over in the United States with a correlation coefficient (R) of -0.389 and weighted average of 66.0%, a difference of 6.6%.
In Labor Force | Age > 16 Correlation Summary
| Measurement | Cherokee | South American Indian |
| Minimum | 23.1% | 43.6% |
| Maximum | 81.8% | 76.5% |
| Range | 58.7% | 32.9% |
| Mean | 54.0% | 60.8% |
| Median | 54.9% | 62.6% |
| Interquartile 25% (IQ1) | 50.9% | 55.4% |
| Interquartile 75% (IQ3) | 59.1% | 66.1% |
| Interquartile Range (IQR) | 8.2% | 10.7% |
| Standard Deviation (Sample) | 8.4% | 7.2% |
| Standard Deviation (Population) | 8.4% | 7.1% |
Similar Demographics by In Labor Force | Age > 16
Demographics Similar to Cherokee by In Labor Force | Age > 16
In terms of in labor force | age > 16, the demographic groups most similar to Cherokee are Cheyenne (62.0%, a difference of 0.050%), Seminole (62.0%, a difference of 0.090%), Ottawa (62.0%, a difference of 0.11%), Sioux (61.8%, a difference of 0.17%), and American (62.1%, a difference of 0.27%).
| Demographics | Rating | Rank | In Labor Force | Age > 16 |
| Chickasaw | 0.0 /100 | #318 | Tragic 62.3% |
| Arapaho | 0.0 /100 | #319 | Tragic 62.1% |
| Yakama | 0.0 /100 | #320 | Tragic 62.1% |
| Americans | 0.0 /100 | #321 | Tragic 62.1% |
| Ottawa | 0.0 /100 | #322 | Tragic 62.0% |
| Seminole | 0.0 /100 | #323 | Tragic 62.0% |
| Cheyenne | 0.0 /100 | #324 | Tragic 62.0% |
| Cherokee | 0.0 /100 | #325 | Tragic 61.9% |
| Sioux | 0.0 /100 | #326 | Tragic 61.8% |
| Cajuns | 0.0 /100 | #327 | Tragic 61.8% |
| Dutch West Indians | 0.0 /100 | #328 | Tragic 61.7% |
| Choctaw | 0.0 /100 | #329 | Tragic 61.5% |
| Creek | 0.0 /100 | #330 | Tragic 61.3% |
| Ute | 0.0 /100 | #331 | Tragic 60.9% |
| Crow | 0.0 /100 | #332 | Tragic 60.8% |
Demographics Similar to South American Indians by In Labor Force | Age > 16
In terms of in labor force | age > 16, the demographic groups most similar to South American Indians are Bermudan (66.0%, a difference of 0.0%), South American (66.0%, a difference of 0.010%), Mongolian (66.1%, a difference of 0.020%), German Russian (66.1%, a difference of 0.040%), and Immigrants from Jordan (66.1%, a difference of 0.040%).
| Demographics | Rating | Rank | In Labor Force | Age > 16 |
| Malaysians | 99.6 /100 | #80 | Exceptional 66.1% |
| Moroccans | 99.5 /100 | #81 | Exceptional 66.1% |
| German Russians | 99.4 /100 | #82 | Exceptional 66.1% |
| Immigrants | Jordan | 99.4 /100 | #83 | Exceptional 66.1% |
| Central Americans | 99.4 /100 | #84 | Exceptional 66.1% |
| Mongolians | 99.4 /100 | #85 | Exceptional 66.1% |
| South Americans | 99.4 /100 | #86 | Exceptional 66.0% |
| South American Indians | 99.4 /100 | #87 | Exceptional 66.0% |
| Bermudans | 99.3 /100 | #88 | Exceptional 66.0% |
| Immigrants | Laos | 99.2 /100 | #89 | Exceptional 66.0% |
| Chileans | 99.2 /100 | #90 | Exceptional 66.0% |
| Iranians | 99.2 /100 | #91 | Exceptional 66.0% |
| Aleuts | 99.1 /100 | #92 | Exceptional 66.0% |
| Immigrants | South America | 99.1 /100 | #93 | Exceptional 66.0% |
| Immigrants | Cambodia | 99.1 /100 | #94 | Exceptional 66.0% |