Aleut vs African In Labor Force | Age 45-54
COMPARE
Aleut
African
In Labor Force | Age 45-54
In Labor Force | Age 45-54 Comparison
Aleuts
Africans
81.0%
IN LABOR FORCE | AGE 45-54
0.0/ 100
METRIC RATING
282nd/ 347
METRIC RANK
80.5%
IN LABOR FORCE | AGE 45-54
0.0/ 100
METRIC RATING
296th/ 347
METRIC RANK
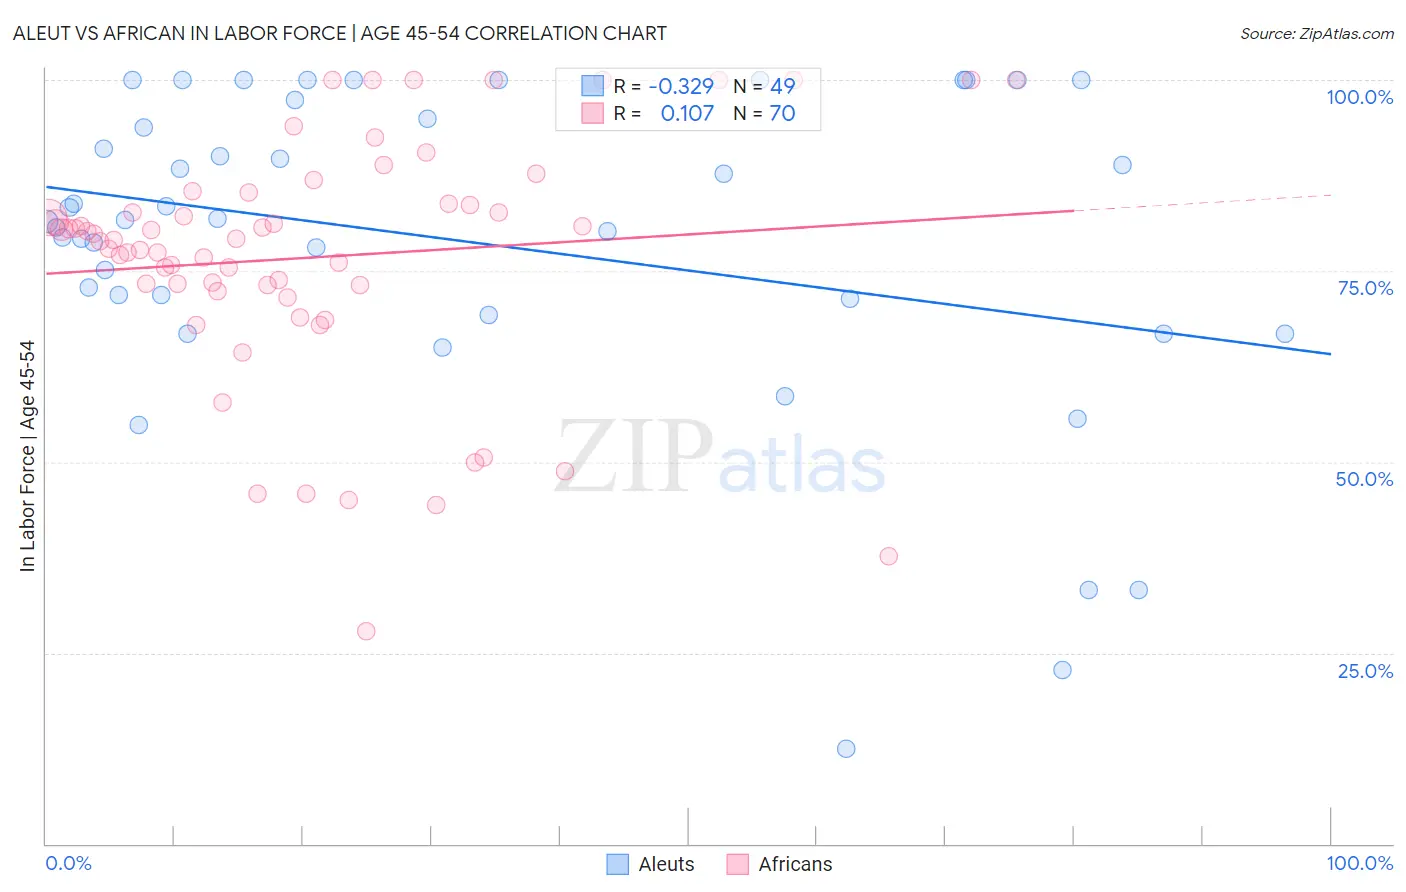
Aleut vs African In Labor Force | Age 45-54 Correlation Chart
The statistical analysis conducted on geographies consisting of 61,774,977 people shows a mild negative correlation between the proportion of Aleuts and labor force participation rate among population between the ages 45 and 54 in the United States with a correlation coefficient (R) of -0.329 and weighted average of 81.0%. Similarly, the statistical analysis conducted on geographies consisting of 469,587,122 people shows a poor positive correlation between the proportion of Africans and labor force participation rate among population between the ages 45 and 54 in the United States with a correlation coefficient (R) of 0.107 and weighted average of 80.5%, a difference of 0.55%.
In Labor Force | Age 45-54 Correlation Summary
| Measurement | Aleut | African |
| Minimum | 12.5% | 27.9% |
| Maximum | 100.0% | 100.0% |
| Range | 87.5% | 72.1% |
| Mean | 78.8% | 76.8% |
| Median | 81.6% | 79.1% |
| Interquartile 25% (IQ1) | 70.3% | 73.2% |
| Interquartile 75% (IQ3) | 96.2% | 83.8% |
| Interquartile Range (IQR) | 25.9% | 10.6% |
| Standard Deviation (Sample) | 20.7% | 15.9% |
| Standard Deviation (Population) | 20.5% | 15.8% |
Demographics Similar to Aleuts and Africans by In Labor Force | Age 45-54
In terms of in labor force | age 45-54, the demographic groups most similar to Aleuts are Immigrants from Latin America (81.0%, a difference of 0.070%), Immigrants from Grenada (81.0%, a difference of 0.070%), French American Indian (80.8%, a difference of 0.17%), Immigrants from Micronesia (81.1%, a difference of 0.18%), and Belizean (80.8%, a difference of 0.22%). Similarly, the demographic groups most similar to Africans are Nepalese (80.5%, a difference of 0.040%), Osage (80.6%, a difference of 0.10%), Yakama (80.6%, a difference of 0.10%), Iroquois (80.6%, a difference of 0.12%), and Immigrants from Belize (80.6%, a difference of 0.15%).
| Demographics | Rating | Rank | In Labor Force | Age 45-54 |
| Immigrants | Micronesia | 0.0 /100 | #279 | Tragic 81.1% |
| Immigrants | Latin America | 0.0 /100 | #280 | Tragic 81.0% |
| Immigrants | Grenada | 0.0 /100 | #281 | Tragic 81.0% |
| Aleuts | 0.0 /100 | #282 | Tragic 81.0% |
| French American Indians | 0.0 /100 | #283 | Tragic 80.8% |
| Belizeans | 0.0 /100 | #284 | Tragic 80.8% |
| Delaware | 0.0 /100 | #285 | Tragic 80.8% |
| Immigrants | Dominica | 0.0 /100 | #286 | Tragic 80.8% |
| Vietnamese | 0.0 /100 | #287 | Tragic 80.8% |
| Cree | 0.0 /100 | #288 | Tragic 80.8% |
| Immigrants | Bangladesh | 0.0 /100 | #289 | Tragic 80.7% |
| Mexican American Indians | 0.0 /100 | #290 | Tragic 80.7% |
| Immigrants | Belize | 0.0 /100 | #291 | Tragic 80.6% |
| Iroquois | 0.0 /100 | #292 | Tragic 80.6% |
| Osage | 0.0 /100 | #293 | Tragic 80.6% |
| Yakama | 0.0 /100 | #294 | Tragic 80.6% |
| Nepalese | 0.0 /100 | #295 | Tragic 80.5% |
| Africans | 0.0 /100 | #296 | Tragic 80.5% |
| Americans | 0.0 /100 | #297 | Tragic 80.4% |
| Marshallese | 0.0 /100 | #298 | Tragic 80.3% |
| Dominicans | 0.0 /100 | #299 | Tragic 80.3% |