Aleut vs Immigrants from Belgium In Labor Force | Age > 16
COMPARE
Aleut
Immigrants from Belgium
In Labor Force | Age > 16
In Labor Force | Age > 16 Comparison
Aleuts
Immigrants from Belgium
66.0%
IN LABOR FORCE | AGE > 16
99.1/ 100
METRIC RATING
92nd/ 347
METRIC RANK
64.9%
IN LABOR FORCE | AGE > 16
19.4/ 100
METRIC RATING
202nd/ 347
METRIC RANK
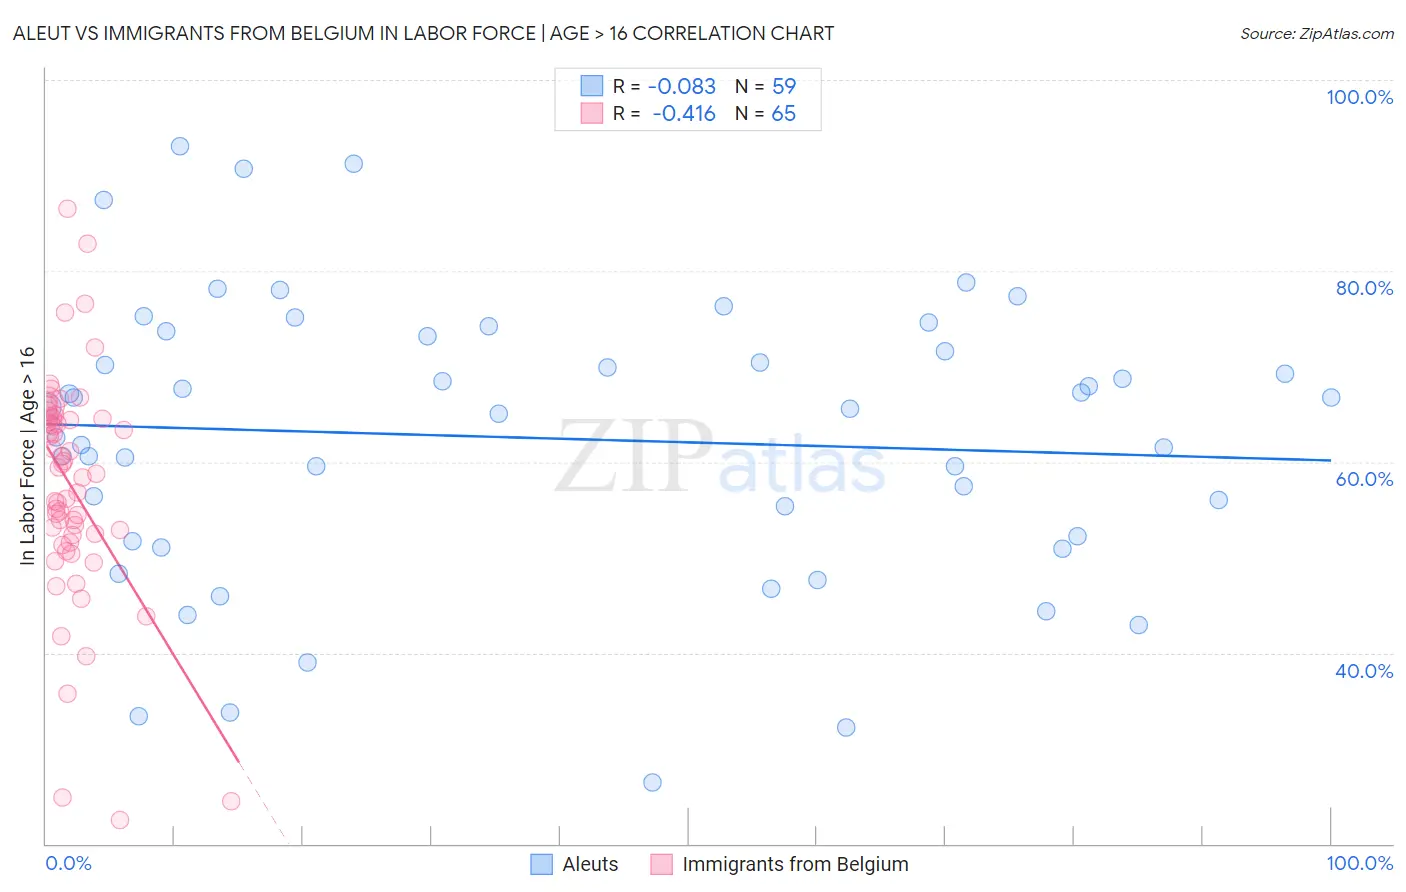
Aleut vs Immigrants from Belgium In Labor Force | Age > 16 Correlation Chart
The statistical analysis conducted on geographies consisting of 61,782,890 people shows a slight negative correlation between the proportion of Aleuts and labor force participation rate among population ages 16 and over in the United States with a correlation coefficient (R) of -0.083 and weighted average of 66.0%. Similarly, the statistical analysis conducted on geographies consisting of 146,728,908 people shows a moderate negative correlation between the proportion of Immigrants from Belgium and labor force participation rate among population ages 16 and over in the United States with a correlation coefficient (R) of -0.416 and weighted average of 64.9%, a difference of 1.7%.
In Labor Force | Age > 16 Correlation Summary
| Measurement | Aleut | Immigrants from Belgium |
| Minimum | 26.4% | 22.5% |
| Maximum | 93.1% | 86.5% |
| Range | 66.7% | 64.0% |
| Mean | 62.5% | 57.3% |
| Median | 65.5% | 58.8% |
| Interquartile 25% (IQ1) | 51.7% | 52.0% |
| Interquartile 75% (IQ3) | 73.1% | 64.6% |
| Interquartile Range (IQR) | 21.4% | 12.6% |
| Standard Deviation (Sample) | 14.9% | 11.9% |
| Standard Deviation (Population) | 14.8% | 11.8% |
Similar Demographics by In Labor Force | Age > 16
Demographics Similar to Aleuts by In Labor Force | Age > 16
In terms of in labor force | age > 16, the demographic groups most similar to Aleuts are Immigrants from South America (66.0%, a difference of 0.010%), Iranian (66.0%, a difference of 0.020%), Immigrants from Cambodia (66.0%, a difference of 0.020%), Immigrants from Uruguay (66.0%, a difference of 0.020%), and Immigrants from Laos (66.0%, a difference of 0.030%).
| Demographics | Rating | Rank | In Labor Force | Age > 16 |
| Mongolians | 99.4 /100 | #85 | Exceptional 66.1% |
| South Americans | 99.4 /100 | #86 | Exceptional 66.0% |
| South American Indians | 99.4 /100 | #87 | Exceptional 66.0% |
| Bermudans | 99.3 /100 | #88 | Exceptional 66.0% |
| Immigrants | Laos | 99.2 /100 | #89 | Exceptional 66.0% |
| Chileans | 99.2 /100 | #90 | Exceptional 66.0% |
| Iranians | 99.2 /100 | #91 | Exceptional 66.0% |
| Aleuts | 99.1 /100 | #92 | Exceptional 66.0% |
| Immigrants | South America | 99.1 /100 | #93 | Exceptional 66.0% |
| Immigrants | Cambodia | 99.1 /100 | #94 | Exceptional 66.0% |
| Immigrants | Uruguay | 99.1 /100 | #95 | Exceptional 66.0% |
| Bangladeshis | 98.9 /100 | #96 | Exceptional 65.9% |
| Filipinos | 98.9 /100 | #97 | Exceptional 65.9% |
| Immigrants | Chile | 98.7 /100 | #98 | Exceptional 65.9% |
| Immigrants | Australia | 98.7 /100 | #99 | Exceptional 65.9% |
Demographics Similar to Immigrants from Belgium by In Labor Force | Age > 16
In terms of in labor force | age > 16, the demographic groups most similar to Immigrants from Belgium are Ukrainian (64.9%, a difference of 0.0%), Russian (64.9%, a difference of 0.010%), Slovene (64.9%, a difference of 0.010%), Jamaican (64.9%, a difference of 0.010%), and Armenian (64.9%, a difference of 0.020%).
| Demographics | Rating | Rank | In Labor Force | Age > 16 |
| Romanians | 31.1 /100 | #195 | Fair 65.0% |
| Haitians | 30.6 /100 | #196 | Fair 65.0% |
| Immigrants | Italy | 28.7 /100 | #197 | Fair 65.0% |
| Greeks | 26.1 /100 | #198 | Fair 64.9% |
| Mexican American Indians | 23.1 /100 | #199 | Fair 64.9% |
| Armenians | 20.2 /100 | #200 | Fair 64.9% |
| Ukrainians | 19.6 /100 | #201 | Poor 64.9% |
| Immigrants | Belgium | 19.4 /100 | #202 | Poor 64.9% |
| Russians | 18.8 /100 | #203 | Poor 64.9% |
| Slovenes | 18.7 /100 | #204 | Poor 64.9% |
| Jamaicans | 18.7 /100 | #205 | Poor 64.9% |
| Lithuanians | 17.4 /100 | #206 | Poor 64.8% |
| Immigrants | Latin America | 16.4 /100 | #207 | Poor 64.8% |
| Belizeans | 16.2 /100 | #208 | Poor 64.8% |
| Immigrants | Trinidad and Tobago | 15.6 /100 | #209 | Poor 64.8% |