Aleut vs Dutch West Indian In Labor Force | Age > 16
COMPARE
Aleut
Dutch West Indian
In Labor Force | Age > 16
In Labor Force | Age > 16 Comparison
Aleuts
Dutch West Indians
66.0%
IN LABOR FORCE | AGE > 16
99.1/ 100
METRIC RATING
92nd/ 347
METRIC RANK
61.7%
IN LABOR FORCE | AGE > 16
0.0/ 100
METRIC RATING
328th/ 347
METRIC RANK
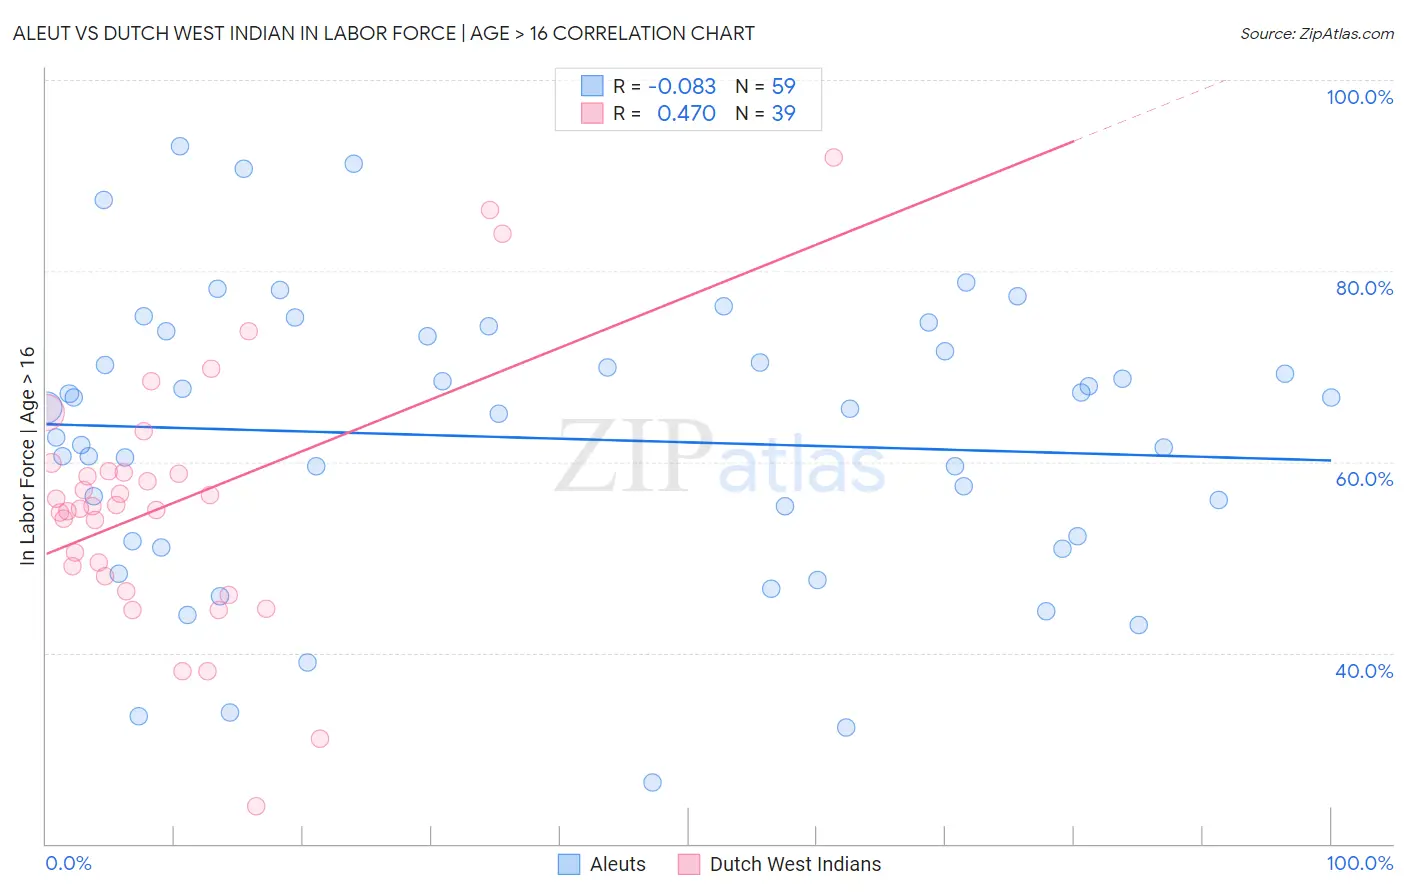
Aleut vs Dutch West Indian In Labor Force | Age > 16 Correlation Chart
The statistical analysis conducted on geographies consisting of 61,782,890 people shows a slight negative correlation between the proportion of Aleuts and labor force participation rate among population ages 16 and over in the United States with a correlation coefficient (R) of -0.083 and weighted average of 66.0%. Similarly, the statistical analysis conducted on geographies consisting of 85,770,506 people shows a moderate positive correlation between the proportion of Dutch West Indians and labor force participation rate among population ages 16 and over in the United States with a correlation coefficient (R) of 0.470 and weighted average of 61.7%, a difference of 7.0%.
In Labor Force | Age > 16 Correlation Summary
| Measurement | Aleut | Dutch West Indian |
| Minimum | 26.4% | 23.9% |
| Maximum | 93.1% | 91.9% |
| Range | 66.7% | 68.0% |
| Mean | 62.5% | 55.8% |
| Median | 65.5% | 55.4% |
| Interquartile 25% (IQ1) | 51.7% | 48.0% |
| Interquartile 75% (IQ3) | 73.1% | 59.0% |
| Interquartile Range (IQR) | 21.4% | 11.1% |
| Standard Deviation (Sample) | 14.9% | 13.5% |
| Standard Deviation (Population) | 14.8% | 13.3% |
Similar Demographics by In Labor Force | Age > 16
Demographics Similar to Aleuts by In Labor Force | Age > 16
In terms of in labor force | age > 16, the demographic groups most similar to Aleuts are Immigrants from South America (66.0%, a difference of 0.010%), Iranian (66.0%, a difference of 0.020%), Immigrants from Cambodia (66.0%, a difference of 0.020%), Immigrants from Uruguay (66.0%, a difference of 0.020%), and Immigrants from Laos (66.0%, a difference of 0.030%).
| Demographics | Rating | Rank | In Labor Force | Age > 16 |
| Mongolians | 99.4 /100 | #85 | Exceptional 66.1% |
| South Americans | 99.4 /100 | #86 | Exceptional 66.0% |
| South American Indians | 99.4 /100 | #87 | Exceptional 66.0% |
| Bermudans | 99.3 /100 | #88 | Exceptional 66.0% |
| Immigrants | Laos | 99.2 /100 | #89 | Exceptional 66.0% |
| Chileans | 99.2 /100 | #90 | Exceptional 66.0% |
| Iranians | 99.2 /100 | #91 | Exceptional 66.0% |
| Aleuts | 99.1 /100 | #92 | Exceptional 66.0% |
| Immigrants | South America | 99.1 /100 | #93 | Exceptional 66.0% |
| Immigrants | Cambodia | 99.1 /100 | #94 | Exceptional 66.0% |
| Immigrants | Uruguay | 99.1 /100 | #95 | Exceptional 66.0% |
| Bangladeshis | 98.9 /100 | #96 | Exceptional 65.9% |
| Filipinos | 98.9 /100 | #97 | Exceptional 65.9% |
| Immigrants | Chile | 98.7 /100 | #98 | Exceptional 65.9% |
| Immigrants | Australia | 98.7 /100 | #99 | Exceptional 65.9% |
Demographics Similar to Dutch West Indians by In Labor Force | Age > 16
In terms of in labor force | age > 16, the demographic groups most similar to Dutch West Indians are Cajun (61.8%, a difference of 0.16%), Sioux (61.8%, a difference of 0.27%), Choctaw (61.5%, a difference of 0.36%), Cherokee (61.9%, a difference of 0.45%), and Cheyenne (62.0%, a difference of 0.49%).
| Demographics | Rating | Rank | In Labor Force | Age > 16 |
| Americans | 0.0 /100 | #321 | Tragic 62.1% |
| Ottawa | 0.0 /100 | #322 | Tragic 62.0% |
| Seminole | 0.0 /100 | #323 | Tragic 62.0% |
| Cheyenne | 0.0 /100 | #324 | Tragic 62.0% |
| Cherokee | 0.0 /100 | #325 | Tragic 61.9% |
| Sioux | 0.0 /100 | #326 | Tragic 61.8% |
| Cajuns | 0.0 /100 | #327 | Tragic 61.8% |
| Dutch West Indians | 0.0 /100 | #328 | Tragic 61.7% |
| Choctaw | 0.0 /100 | #329 | Tragic 61.5% |
| Creek | 0.0 /100 | #330 | Tragic 61.3% |
| Ute | 0.0 /100 | #331 | Tragic 60.9% |
| Crow | 0.0 /100 | #332 | Tragic 60.8% |
| Paiute | 0.0 /100 | #333 | Tragic 60.7% |
| Apache | 0.0 /100 | #334 | Tragic 60.7% |
| Natives/Alaskans | 0.0 /100 | #335 | Tragic 60.6% |