Aleut vs African Divorced or Separated
COMPARE
Aleut
African
Divorced or Separated
Divorced or Separated Comparison
Aleuts
Africans
12.5%
DIVORCED OR SEPARATED
1.3/ 100
METRIC RATING
251st/ 347
METRIC RANK
13.2%
DIVORCED OR SEPARATED
0.0/ 100
METRIC RATING
310th/ 347
METRIC RANK
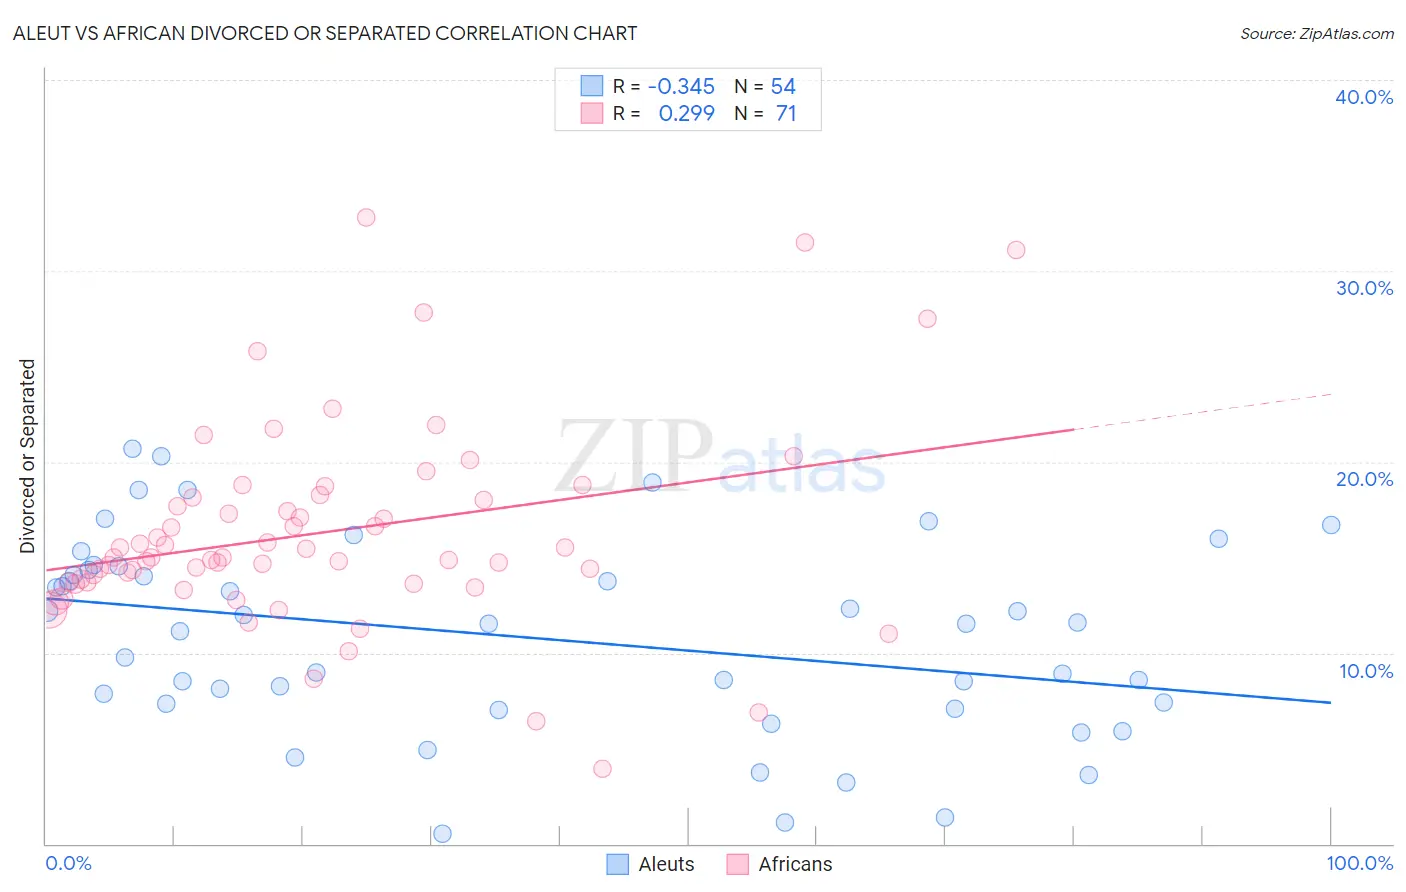
Aleut vs African Divorced or Separated Correlation Chart
The statistical analysis conducted on geographies consisting of 61,777,142 people shows a mild negative correlation between the proportion of Aleuts and percentage of population currently divorced or separated in the United States with a correlation coefficient (R) of -0.345 and weighted average of 12.5%. Similarly, the statistical analysis conducted on geographies consisting of 469,800,518 people shows a weak positive correlation between the proportion of Africans and percentage of population currently divorced or separated in the United States with a correlation coefficient (R) of 0.299 and weighted average of 13.2%, a difference of 5.8%.
Divorced or Separated Correlation Summary
| Measurement | Aleut | African |
| Minimum | 0.50% | 3.9% |
| Maximum | 20.7% | 32.8% |
| Range | 20.2% | 28.9% |
| Mean | 10.8% | 16.3% |
| Median | 11.5% | 15.0% |
| Interquartile 25% (IQ1) | 7.3% | 13.7% |
| Interquartile 75% (IQ3) | 14.3% | 18.1% |
| Interquartile Range (IQR) | 7.0% | 4.4% |
| Standard Deviation (Sample) | 5.1% | 5.3% |
| Standard Deviation (Population) | 5.0% | 5.3% |
Similar Demographics by Divorced or Separated
Demographics Similar to Aleuts by Divorced or Separated
In terms of divorced or separated, the demographic groups most similar to Aleuts are Irish (12.5%, a difference of 0.0%), Finnish (12.5%, a difference of 0.28%), Nepalese (12.5%, a difference of 0.29%), German (12.5%, a difference of 0.31%), and Liberian (12.6%, a difference of 0.33%).
| Demographics | Rating | Rank | Divorced or Separated |
| Alaska Natives | 2.5 /100 | #244 | Tragic 12.4% |
| Hispanics or Latinos | 2.0 /100 | #245 | Tragic 12.5% |
| Immigrants | West Indies | 1.9 /100 | #246 | Tragic 12.5% |
| Germans | 1.8 /100 | #247 | Tragic 12.5% |
| Nepalese | 1.8 /100 | #248 | Tragic 12.5% |
| Finns | 1.8 /100 | #249 | Tragic 12.5% |
| Irish | 1.3 /100 | #250 | Tragic 12.5% |
| Aleuts | 1.3 /100 | #251 | Tragic 12.5% |
| Liberians | 0.9 /100 | #252 | Tragic 12.6% |
| Somalis | 0.9 /100 | #253 | Tragic 12.6% |
| Senegalese | 0.8 /100 | #254 | Tragic 12.6% |
| Welsh | 0.7 /100 | #255 | Tragic 12.6% |
| Immigrants | Colombia | 0.6 /100 | #256 | Tragic 12.6% |
| Immigrants | Somalia | 0.6 /100 | #257 | Tragic 12.6% |
| Indonesians | 0.6 /100 | #258 | Tragic 12.6% |
Demographics Similar to Africans by Divorced or Separated
In terms of divorced or separated, the demographic groups most similar to Africans are American (13.2%, a difference of 0.020%), Sioux (13.2%, a difference of 0.020%), Ottawa (13.2%, a difference of 0.030%), French American Indian (13.2%, a difference of 0.12%), and Blackfeet (13.3%, a difference of 0.37%).
| Demographics | Rating | Rank | Divorced or Separated |
| Cape Verdeans | 0.0 /100 | #303 | Tragic 13.1% |
| Hopi | 0.0 /100 | #304 | Tragic 13.2% |
| Chippewa | 0.0 /100 | #305 | Tragic 13.2% |
| Tlingit-Haida | 0.0 /100 | #306 | Tragic 13.2% |
| French American Indians | 0.0 /100 | #307 | Tragic 13.2% |
| Ottawa | 0.0 /100 | #308 | Tragic 13.2% |
| Americans | 0.0 /100 | #309 | Tragic 13.2% |
| Africans | 0.0 /100 | #310 | Tragic 13.2% |
| Sioux | 0.0 /100 | #311 | Tragic 13.2% |
| Blackfeet | 0.0 /100 | #312 | Tragic 13.3% |
| Immigrants | Nicaragua | 0.0 /100 | #313 | Tragic 13.3% |
| Yaqui | 0.0 /100 | #314 | Tragic 13.3% |
| Spanish Americans | 0.0 /100 | #315 | Tragic 13.3% |
| Tsimshian | 0.0 /100 | #316 | Tragic 13.3% |
| Haitians | 0.0 /100 | #317 | Tragic 13.3% |