Aleut vs African 2nd Grade
COMPARE
Aleut
African
2nd Grade
2nd Grade Comparison
Aleuts
Africans
98.6%
2ND GRADE
100.0/ 100
METRIC RATING
17th/ 347
METRIC RANK
97.7%
2ND GRADE
15.6/ 100
METRIC RATING
207th/ 347
METRIC RANK
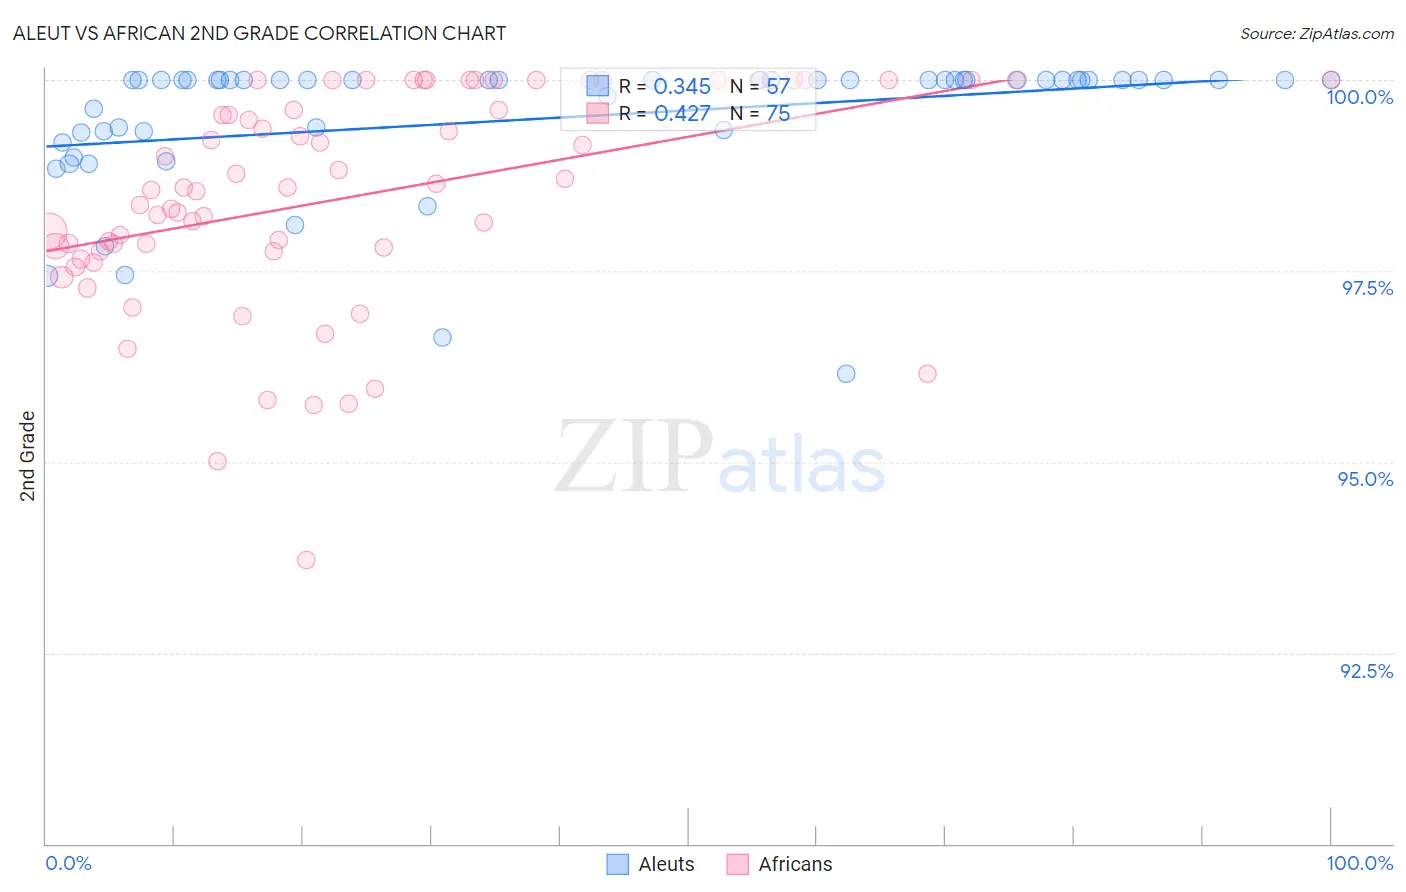
Aleut vs African 2nd Grade Correlation Chart
The statistical analysis conducted on geographies consisting of 61,781,033 people shows a mild positive correlation between the proportion of Aleuts and percentage of population with at least 2nd grade education in the United States with a correlation coefficient (R) of 0.345 and weighted average of 98.6%. Similarly, the statistical analysis conducted on geographies consisting of 470,094,148 people shows a moderate positive correlation between the proportion of Africans and percentage of population with at least 2nd grade education in the United States with a correlation coefficient (R) of 0.427 and weighted average of 97.7%, a difference of 0.85%.
2nd Grade Correlation Summary
| Measurement | Aleut | African |
| Minimum | 96.2% | 93.7% |
| Maximum | 100.0% | 100.0% |
| Range | 3.8% | 6.3% |
| Mean | 99.5% | 98.5% |
| Median | 100.0% | 98.6% |
| Interquartile 25% (IQ1) | 99.3% | 97.8% |
| Interquartile 75% (IQ3) | 100.0% | 100.0% |
| Interquartile Range (IQR) | 0.68% | 2.2% |
| Standard Deviation (Sample) | 0.90% | 1.4% |
| Standard Deviation (Population) | 0.89% | 1.4% |
Similar Demographics by 2nd Grade
Demographics Similar to Aleuts by 2nd Grade
In terms of 2nd grade, the demographic groups most similar to Aleuts are Irish (98.6%, a difference of 0.0%), Finnish (98.5%, a difference of 0.010%), Scottish (98.6%, a difference of 0.020%), Dutch (98.6%, a difference of 0.020%), and Sioux (98.5%, a difference of 0.020%).
| Demographics | Rating | Rank | 2nd Grade |
| Slovenes | 100.0 /100 | #10 | Exceptional 98.6% |
| Tlingit-Haida | 100.0 /100 | #11 | Exceptional 98.6% |
| Carpatho Rusyns | 100.0 /100 | #12 | Exceptional 98.6% |
| English | 100.0 /100 | #13 | Exceptional 98.6% |
| Swedes | 100.0 /100 | #14 | Exceptional 98.6% |
| Scottish | 100.0 /100 | #15 | Exceptional 98.6% |
| Dutch | 100.0 /100 | #16 | Exceptional 98.6% |
| Aleuts | 100.0 /100 | #17 | Exceptional 98.6% |
| Irish | 100.0 /100 | #18 | Exceptional 98.6% |
| Finns | 100.0 /100 | #19 | Exceptional 98.5% |
| Sioux | 100.0 /100 | #20 | Exceptional 98.5% |
| Lithuanians | 100.0 /100 | #21 | Exceptional 98.5% |
| Poles | 100.0 /100 | #22 | Exceptional 98.5% |
| Danes | 100.0 /100 | #23 | Exceptional 98.5% |
| Pennsylvania Germans | 100.0 /100 | #24 | Exceptional 98.5% |
Demographics Similar to Africans by 2nd Grade
In terms of 2nd grade, the demographic groups most similar to Africans are Immigrants from Southern Europe (97.8%, a difference of 0.010%), Immigrants from Chile (97.7%, a difference of 0.010%), Yuman (97.8%, a difference of 0.020%), Immigrants from Albania (97.8%, a difference of 0.020%), and Immigrants from Northern Africa (97.7%, a difference of 0.020%).
| Demographics | Rating | Rank | 2nd Grade |
| Immigrants | Lebanon | 20.9 /100 | #200 | Fair 97.8% |
| Tohono O'odham | 20.9 /100 | #201 | Fair 97.8% |
| Immigrants | Ukraine | 20.5 /100 | #202 | Fair 97.8% |
| Yuman | 20.0 /100 | #203 | Fair 97.8% |
| Immigrants | Albania | 18.4 /100 | #204 | Poor 97.8% |
| Immigrants | Southern Europe | 18.1 /100 | #205 | Poor 97.8% |
| Immigrants | Chile | 17.3 /100 | #206 | Poor 97.7% |
| Africans | 15.6 /100 | #207 | Poor 97.7% |
| Immigrants | Northern Africa | 12.3 /100 | #208 | Poor 97.7% |
| Immigrants | Oceania | 10.9 /100 | #209 | Poor 97.7% |
| Costa Ricans | 10.5 /100 | #210 | Poor 97.7% |
| Laotians | 9.9 /100 | #211 | Tragic 97.7% |
| Immigrants | Bahamas | 8.4 /100 | #212 | Tragic 97.7% |
| Moroccans | 8.2 /100 | #213 | Tragic 97.7% |
| Samoans | 7.1 /100 | #214 | Tragic 97.7% |