Zip Codes with the Highest Percentage of Population Employed in Accommodation & Food Services in Baton Rouge, LA
RELATED REPORTS & OPTIONS
Accommodation & Food Services
Baton Rouge
Compare Zip Codes
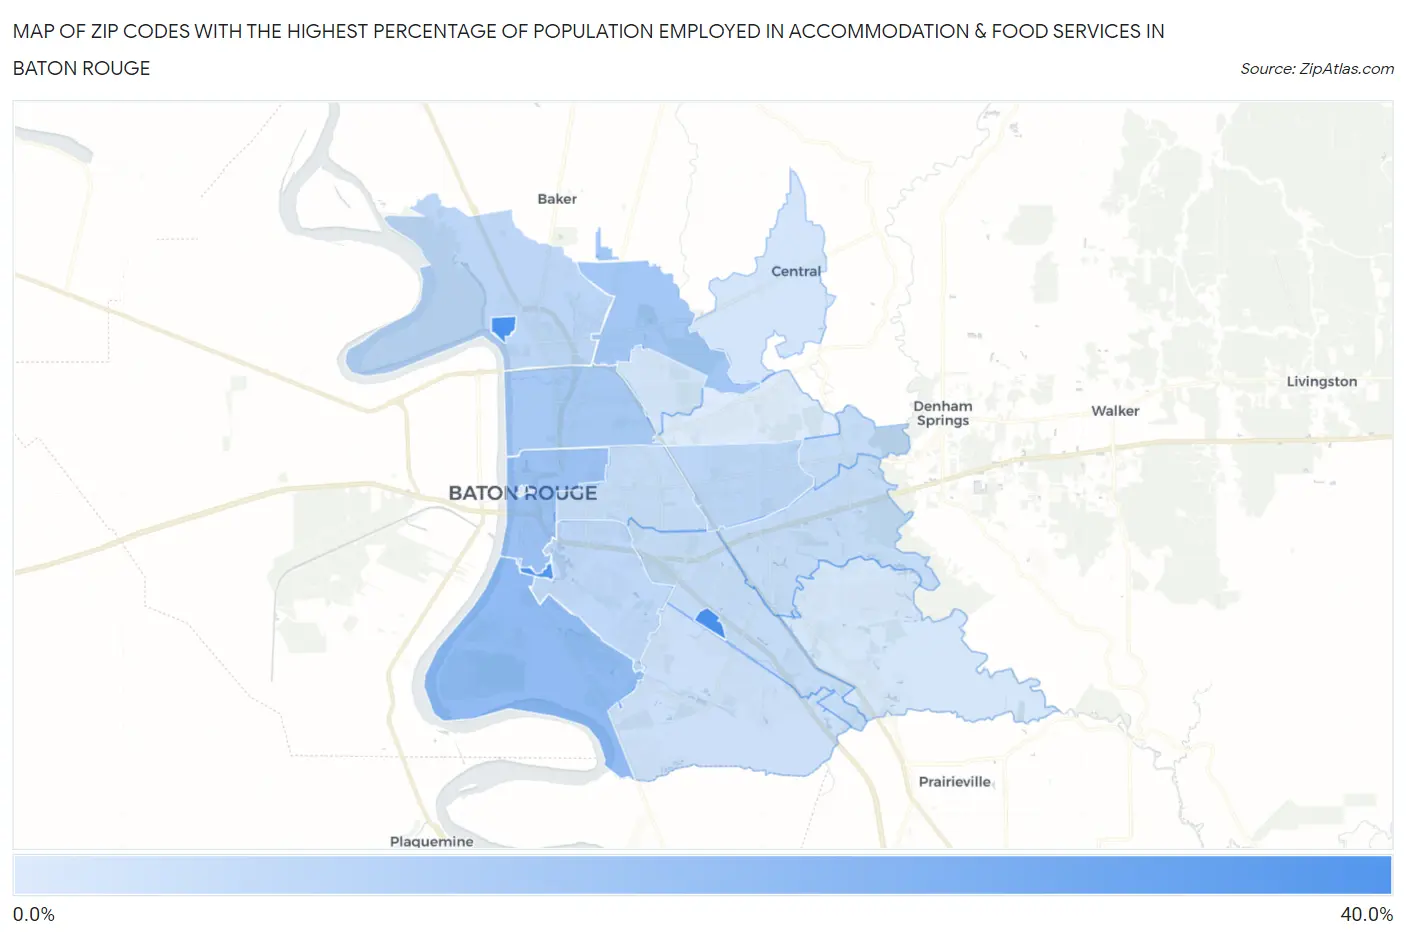
Map of Zip Codes with the Highest Percentage of Population Employed in Accommodation & Food Services in Baton Rouge
3.7%
30.4%
Zip Codes with the Highest Percentage of Population Employed in Accommodation & Food Services in Baton Rouge, LA
| Zip Code | % Employed | vs State | vs National | |
| 1. | 70836 | 30.4% | 7.6%(+22.8)#8 | 6.9%(+23.5)#317 |
| 2. | 70813 | 30.0% | 7.6%(+22.4)#10 | 6.9%(+23.1)#331 |
| 3. | 70803 | 27.7% | 7.6%(+20.1)#11 | 6.9%(+20.8)#395 |
| 4. | 70820 | 16.5% | 7.6%(+8.87)#23 | 6.9%(+9.60)#1,352 |
| 5. | 70802 | 14.8% | 7.6%(+7.23)#34 | 6.9%(+7.96)#1,723 |
| 6. | 70811 | 13.3% | 7.6%(+5.66)#44 | 6.9%(+6.38)#2,242 |
| 7. | 70805 | 12.5% | 7.6%(+4.93)#57 | 6.9%(+5.66)#2,571 |
| 8. | 70807 | 8.9% | 7.6%(+1.24)#114 | 6.9%(+1.97)#6,184 |
| 9. | 70815 | 8.8% | 7.6%(+1.21)#115 | 6.9%(+1.94)#6,247 |
| 10. | 70808 | 8.5% | 7.6%(+0.921)#122 | 6.9%(+1.65)#6,766 |
| 11. | 70806 | 7.6% | 7.6%(-0.024)#154 | 6.9%(+0.705)#8,779 |
| 12. | 70819 | 7.6% | 7.6%(-0.056)#155 | 6.9%(+0.673)#8,852 |
| 13. | 70816 | 7.5% | 7.6%(-0.137)#159 | 6.9%(+0.592)#9,050 |
| 14. | 70809 | 7.4% | 7.6%(-0.234)#165 | 6.9%(+0.495)#9,311 |
| 15. | 70810 | 6.2% | 7.6%(-1.45)#216 | 6.9%(-0.723)#12,937 |
| 16. | 70818 | 5.3% | 7.6%(-2.30)#253 | 6.9%(-1.57)#15,741 |
| 17. | 70812 | 5.1% | 7.6%(-2.52)#265 | 6.9%(-1.79)#16,504 |
| 18. | 70817 | 4.7% | 7.6%(-2.95)#279 | 6.9%(-2.22)#17,945 |
| 19. | 70814 | 3.7% | 7.6%(-3.91)#316 | 6.9%(-3.18)#21,134 |
1
Common Questions
What are the Top 10 Zip Codes with the Highest Percentage of Population Employed in Accommodation & Food Services in Baton Rouge, LA?
Top 10 Zip Codes with the Highest Percentage of Population Employed in Accommodation & Food Services in Baton Rouge, LA are:
What zip code has the Highest Percentage of Population Employed in Accommodation & Food Services in Baton Rouge, LA?
70836 has the Highest Percentage of Population Employed in Accommodation & Food Services in Baton Rouge, LA with 30.4%.
What is the Percentage of Population Employed in Accommodation & Food Services in Baton Rouge, LA?
Percentage of Population Employed in Accommodation & Food Services in Baton Rouge is 10.1%.
What is the Percentage of Population Employed in Accommodation & Food Services in Louisiana?
Percentage of Population Employed in Accommodation & Food Services in Louisiana is 7.6%.
What is the Percentage of Population Employed in Accommodation & Food Services in the United States?
Percentage of Population Employed in Accommodation & Food Services in the United States is 6.9%.