Zip Codes with the Highest Percentage of Population Employed in Accommodation & Food Services in Alexandria, LA
RELATED REPORTS & OPTIONS
Accommodation & Food Services
Alexandria
Compare Zip Codes
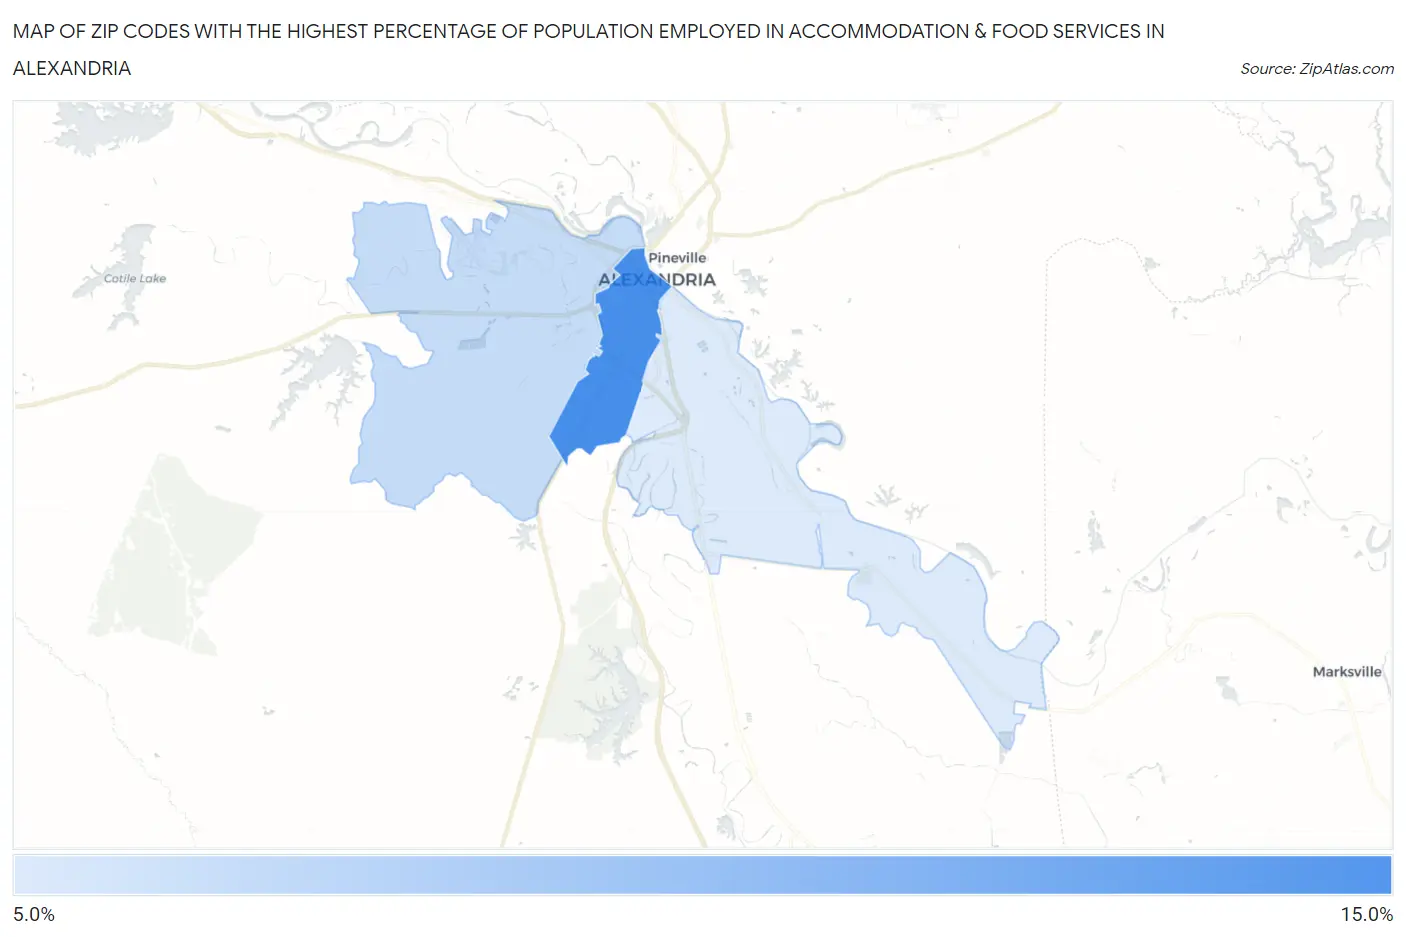
Map of Zip Codes with the Highest Percentage of Population Employed in Accommodation & Food Services in Alexandria
11.4%
13.1%
Zip Codes with the Highest Percentage of Population Employed in Accommodation & Food Services in Alexandria, LA
| Zip Code | % Employed | vs State | vs National | |
| 1. | 71301 | 13.1% | 7.6%(+5.46)#46 | 6.9%(+6.19)#2,319 |
| 2. | 71303 | 11.6% | 7.6%(+4.02)#66 | 6.9%(+4.75)#3,072 |
| 3. | 71302 | 11.4% | 7.6%(+3.77)#68 | 6.9%(+4.50)#3,245 |
1
Common Questions
What are the Top Zip Codes with the Highest Percentage of Population Employed in Accommodation & Food Services in Alexandria, LA?
Top Zip Codes with the Highest Percentage of Population Employed in Accommodation & Food Services in Alexandria, LA are:
What zip code has the Highest Percentage of Population Employed in Accommodation & Food Services in Alexandria, LA?
71301 has the Highest Percentage of Population Employed in Accommodation & Food Services in Alexandria, LA with 13.1%.
What is the Percentage of Population Employed in Accommodation & Food Services in Alexandria, LA?
Percentage of Population Employed in Accommodation & Food Services in Alexandria is 11.4%.
What is the Percentage of Population Employed in Accommodation & Food Services in Louisiana?
Percentage of Population Employed in Accommodation & Food Services in Louisiana is 7.6%.
What is the Percentage of Population Employed in Accommodation & Food Services in the United States?
Percentage of Population Employed in Accommodation & Food Services in the United States is 6.9%.