Zip Codes with the Highest Percentage of Population Employed in Accommodation & Food Services in Hammond, LA
RELATED REPORTS & OPTIONS
Accommodation & Food Services
Hammond
Compare Zip Codes
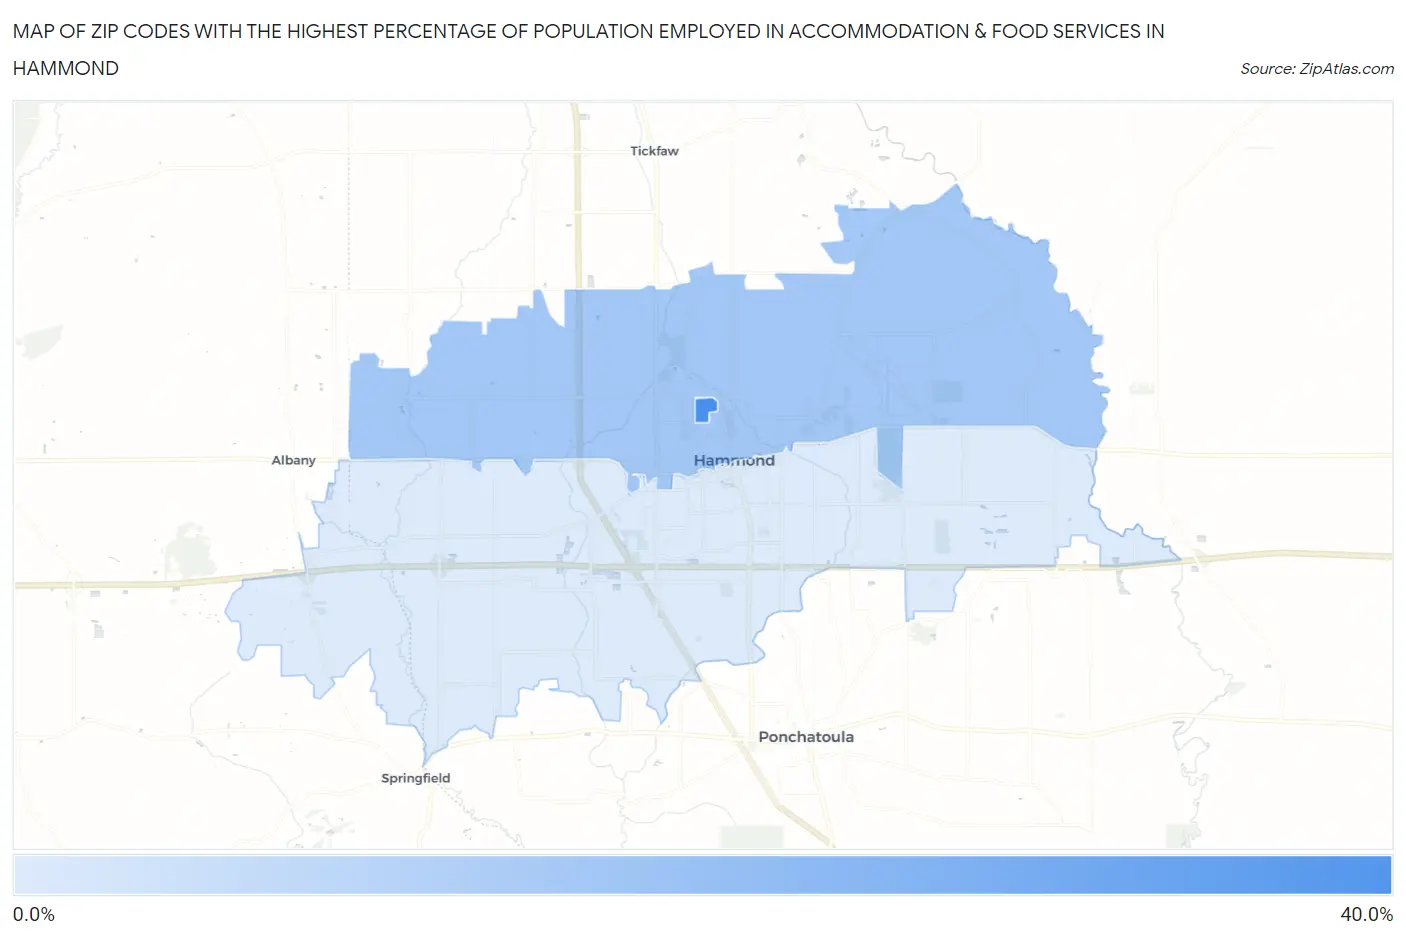
Map of Zip Codes with the Highest Percentage of Population Employed in Accommodation & Food Services in Hammond
9.8%
37.5%
Zip Codes with the Highest Percentage of Population Employed in Accommodation & Food Services in Hammond, LA
| Zip Code | % Employed | vs State | vs National | |
| 1. | 70402 | 37.5% | 7.6%(+29.8)#6 | 6.9%(+30.6)#191 |
| 2. | 70401 | 19.7% | 7.6%(+12.0)#16 | 6.9%(+12.8)#863 |
| 3. | 70403 | 9.8% | 7.6%(+2.16)#92 | 6.9%(+2.89)#4,823 |
1
Common Questions
What are the Top Zip Codes with the Highest Percentage of Population Employed in Accommodation & Food Services in Hammond, LA?
Top Zip Codes with the Highest Percentage of Population Employed in Accommodation & Food Services in Hammond, LA are:
What zip code has the Highest Percentage of Population Employed in Accommodation & Food Services in Hammond, LA?
70402 has the Highest Percentage of Population Employed in Accommodation & Food Services in Hammond, LA with 37.5%.
What is the Percentage of Population Employed in Accommodation & Food Services in Hammond, LA?
Percentage of Population Employed in Accommodation & Food Services in Hammond is 20.0%.
What is the Percentage of Population Employed in Accommodation & Food Services in Louisiana?
Percentage of Population Employed in Accommodation & Food Services in Louisiana is 7.6%.
What is the Percentage of Population Employed in Accommodation & Food Services in the United States?
Percentage of Population Employed in Accommodation & Food Services in the United States is 6.9%.