Zip Codes with the Highest Percentage of Population Employed in Legal Services & Support in Kansas City, KS
RELATED REPORTS & OPTIONS
Legal Services & Support
Kansas City
Compare Zip Codes
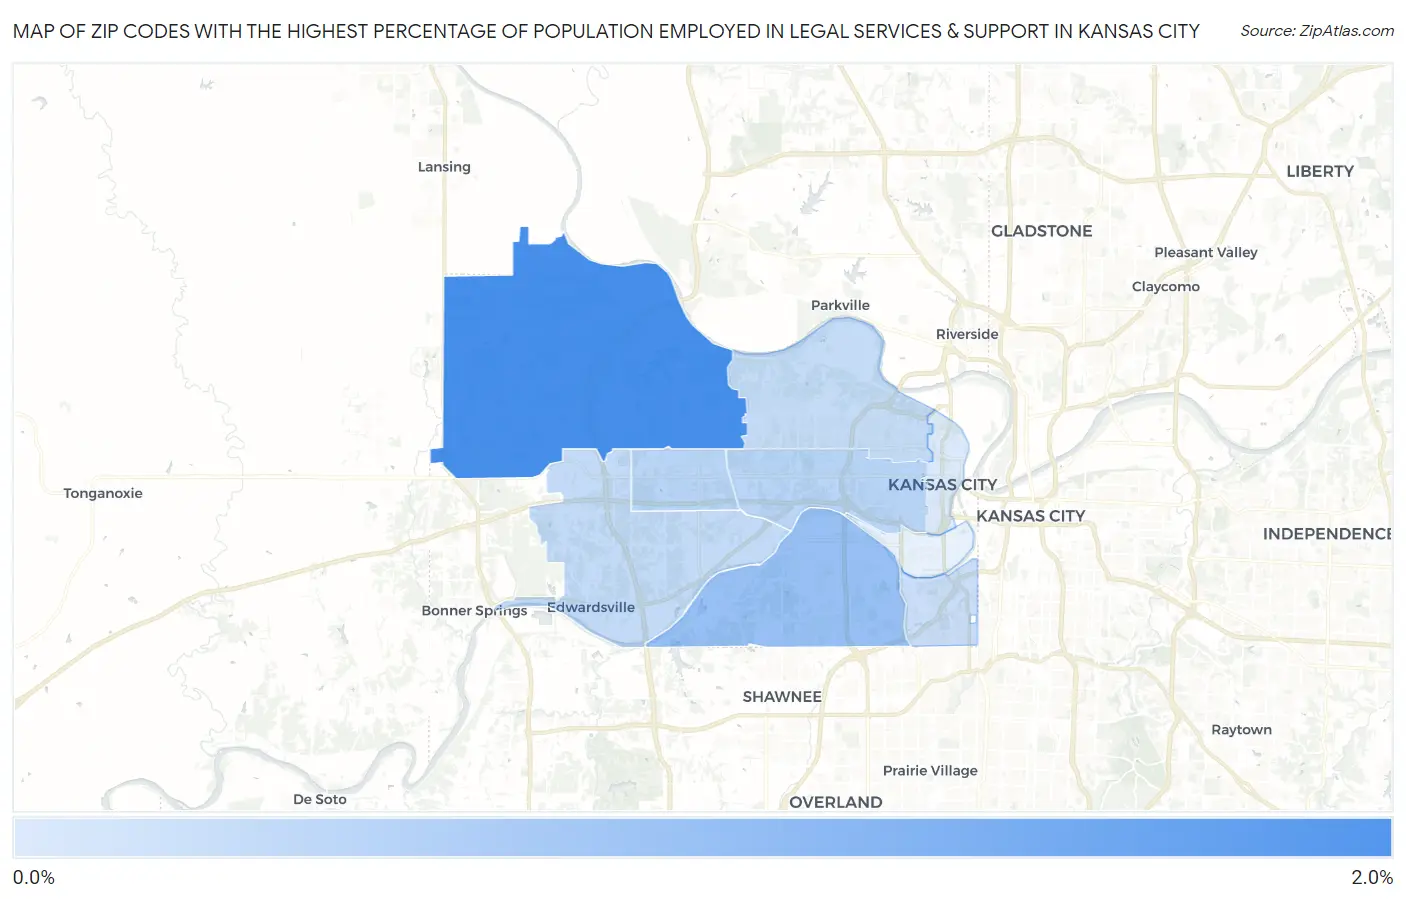
Map of Zip Codes with the Highest Percentage of Population Employed in Legal Services & Support in Kansas City
0.076%
1.6%
Zip Codes with the Highest Percentage of Population Employed in Legal Services & Support in Kansas City, KS
| Zip Code | % Employed | vs State | vs National | |
| 1. | 66109 | 1.6% | 0.90%(+0.674)#56 | 1.2%(+0.391)#4,762 |
| 2. | 66106 | 0.77% | 0.90%(-0.128)#117 | 1.2%(-0.411)#9,714 |
| 3. | 66102 | 0.43% | 0.90%(-0.472)#181 | 1.2%(-0.755)#13,506 |
| 4. | 66112 | 0.42% | 0.90%(-0.484)#182 | 1.2%(-0.767)#13,645 |
| 5. | 66111 | 0.33% | 0.90%(-0.574)#200 | 1.2%(-0.857)#14,740 |
| 6. | 66104 | 0.30% | 0.90%(-0.600)#208 | 1.2%(-0.883)#15,031 |
| 7. | 66103 | 0.26% | 0.90%(-0.638)#212 | 1.2%(-0.921)#15,471 |
| 8. | 66101 | 0.076% | 0.90%(-0.825)#260 | 1.2%(-1.11)#17,303 |
1
Common Questions
What are the Top 5 Zip Codes with the Highest Percentage of Population Employed in Legal Services & Support in Kansas City, KS?
Top 5 Zip Codes with the Highest Percentage of Population Employed in Legal Services & Support in Kansas City, KS are:
What zip code has the Highest Percentage of Population Employed in Legal Services & Support in Kansas City, KS?
66109 has the Highest Percentage of Population Employed in Legal Services & Support in Kansas City, KS with 1.6%.
What is the Percentage of Population Employed in Legal Services & Support in Kansas City, KS?
Percentage of Population Employed in Legal Services & Support in Kansas City is 0.63%.
What is the Percentage of Population Employed in Legal Services & Support in Kansas?
Percentage of Population Employed in Legal Services & Support in Kansas is 0.90%.
What is the Percentage of Population Employed in Legal Services & Support in the United States?
Percentage of Population Employed in Legal Services & Support in the United States is 1.2%.