Yup'ik vs Immigrants from Chile Householder Income Ages 45 - 64 years
COMPARE
Yup'ik
Immigrants from Chile
Householder Income Ages 45 - 64 years
Householder Income Ages 45 - 64 years Comparison
Yup'ik
Immigrants from Chile
$81,000
HOUSEHOLDER INCOME AGES 45 - 64 YEARS
0.0/ 100
METRIC RATING
324th/ 347
METRIC RANK
$103,412
HOUSEHOLDER INCOME AGES 45 - 64 YEARS
82.5/ 100
METRIC RATING
146th/ 347
METRIC RANK
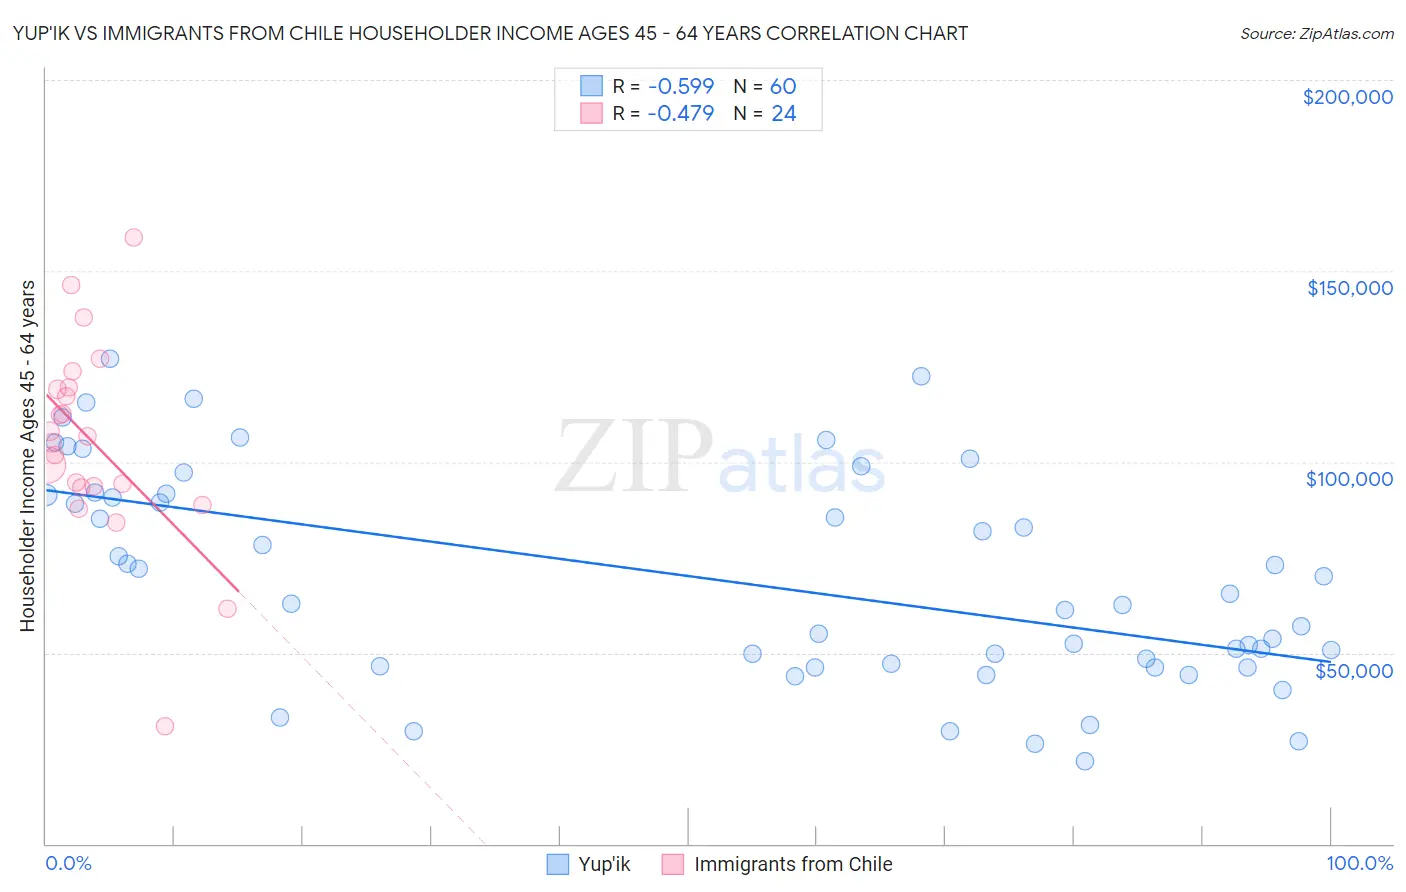
Yup'ik vs Immigrants from Chile Householder Income Ages 45 - 64 years Correlation Chart
The statistical analysis conducted on geographies consisting of 39,943,055 people shows a substantial negative correlation between the proportion of Yup'ik and household income with householder between the ages 45 and 64 in the United States with a correlation coefficient (R) of -0.599 and weighted average of $81,000. Similarly, the statistical analysis conducted on geographies consisting of 218,523,915 people shows a moderate negative correlation between the proportion of Immigrants from Chile and household income with householder between the ages 45 and 64 in the United States with a correlation coefficient (R) of -0.479 and weighted average of $103,412, a difference of 27.7%.
Householder Income Ages 45 - 64 years Correlation Summary
| Measurement | Yup'ik | Immigrants from Chile |
| Minimum | $21,563 | $30,865 |
| Maximum | $127,108 | $158,750 |
| Range | $105,545 | $127,885 |
| Mean | $69,372 | $105,152 |
| Median | $64,271 | $105,926 |
| Interquartile 25% (IQ1) | $46,840 | $93,461 |
| Interquartile 75% (IQ3) | $91,495 | $119,302 |
| Interquartile Range (IQR) | $44,656 | $25,840 |
| Standard Deviation (Sample) | $27,859 | $26,462 |
| Standard Deviation (Population) | $27,626 | $25,904 |
Similar Demographics by Householder Income Ages 45 - 64 years
Demographics Similar to Yup'ik by Householder Income Ages 45 - 64 years
In terms of householder income ages 45 - 64 years, the demographic groups most similar to Yup'ik are Immigrants from Cuba ($80,662, a difference of 0.42%), Bahamian ($81,369, a difference of 0.46%), Dominican ($80,623, a difference of 0.47%), Sioux ($81,750, a difference of 0.93%), and Seminole ($80,077, a difference of 1.1%).
| Demographics | Rating | Rank | Householder Income Ages 45 - 64 years |
| Colville | 0.0 /100 | #317 | Tragic $82,474 |
| Choctaw | 0.0 /100 | #318 | Tragic $82,287 |
| Chickasaw | 0.0 /100 | #319 | Tragic $82,193 |
| Apache | 0.0 /100 | #320 | Tragic $82,184 |
| Yuman | 0.0 /100 | #321 | Tragic $82,139 |
| Sioux | 0.0 /100 | #322 | Tragic $81,750 |
| Bahamians | 0.0 /100 | #323 | Tragic $81,369 |
| Yup'ik | 0.0 /100 | #324 | Tragic $81,000 |
| Immigrants | Cuba | 0.0 /100 | #325 | Tragic $80,662 |
| Dominicans | 0.0 /100 | #326 | Tragic $80,623 |
| Seminole | 0.0 /100 | #327 | Tragic $80,077 |
| Natives/Alaskans | 0.0 /100 | #328 | Tragic $79,816 |
| Dutch West Indians | 0.0 /100 | #329 | Tragic $79,171 |
| Creek | 0.0 /100 | #330 | Tragic $78,960 |
| Immigrants | Dominican Republic | 0.0 /100 | #331 | Tragic $78,836 |
Demographics Similar to Immigrants from Chile by Householder Income Ages 45 - 64 years
In terms of householder income ages 45 - 64 years, the demographic groups most similar to Immigrants from Chile are Basque ($103,387, a difference of 0.020%), Ugandan ($103,472, a difference of 0.060%), Czech ($103,507, a difference of 0.090%), Serbian ($103,522, a difference of 0.11%), and Luxembourger ($103,536, a difference of 0.12%).
| Demographics | Rating | Rank | Householder Income Ages 45 - 64 years |
| Immigrants | Oceania | 84.5 /100 | #139 | Excellent $103,705 |
| Norwegians | 84.3 /100 | #140 | Excellent $103,682 |
| Immigrants | Uganda | 83.7 /100 | #141 | Excellent $103,584 |
| Luxembourgers | 83.3 /100 | #142 | Excellent $103,536 |
| Serbians | 83.2 /100 | #143 | Excellent $103,522 |
| Czechs | 83.1 /100 | #144 | Excellent $103,507 |
| Ugandans | 82.9 /100 | #145 | Excellent $103,472 |
| Immigrants | Chile | 82.5 /100 | #146 | Excellent $103,412 |
| Basques | 82.3 /100 | #147 | Excellent $103,387 |
| Immigrants | Germany | 81.5 /100 | #148 | Excellent $103,282 |
| Immigrants | Sierra Leone | 81.1 /100 | #149 | Excellent $103,227 |
| Immigrants | Peru | 80.7 /100 | #150 | Excellent $103,173 |
| Swiss | 79.9 /100 | #151 | Good $103,071 |
| Irish | 79.8 /100 | #152 | Good $103,067 |
| Scandinavians | 79.0 /100 | #153 | Good $102,969 |