Yup'ik vs Subsaharan African Householder Income Ages 45 - 64 years
COMPARE
Yup'ik
Subsaharan African
Householder Income Ages 45 - 64 years
Householder Income Ages 45 - 64 years Comparison
Yup'ik
Sub-Saharan Africans
$81,000
HOUSEHOLDER INCOME AGES 45 - 64 YEARS
0.0/ 100
METRIC RATING
324th/ 347
METRIC RANK
$90,691
HOUSEHOLDER INCOME AGES 45 - 64 YEARS
0.8/ 100
METRIC RATING
250th/ 347
METRIC RANK
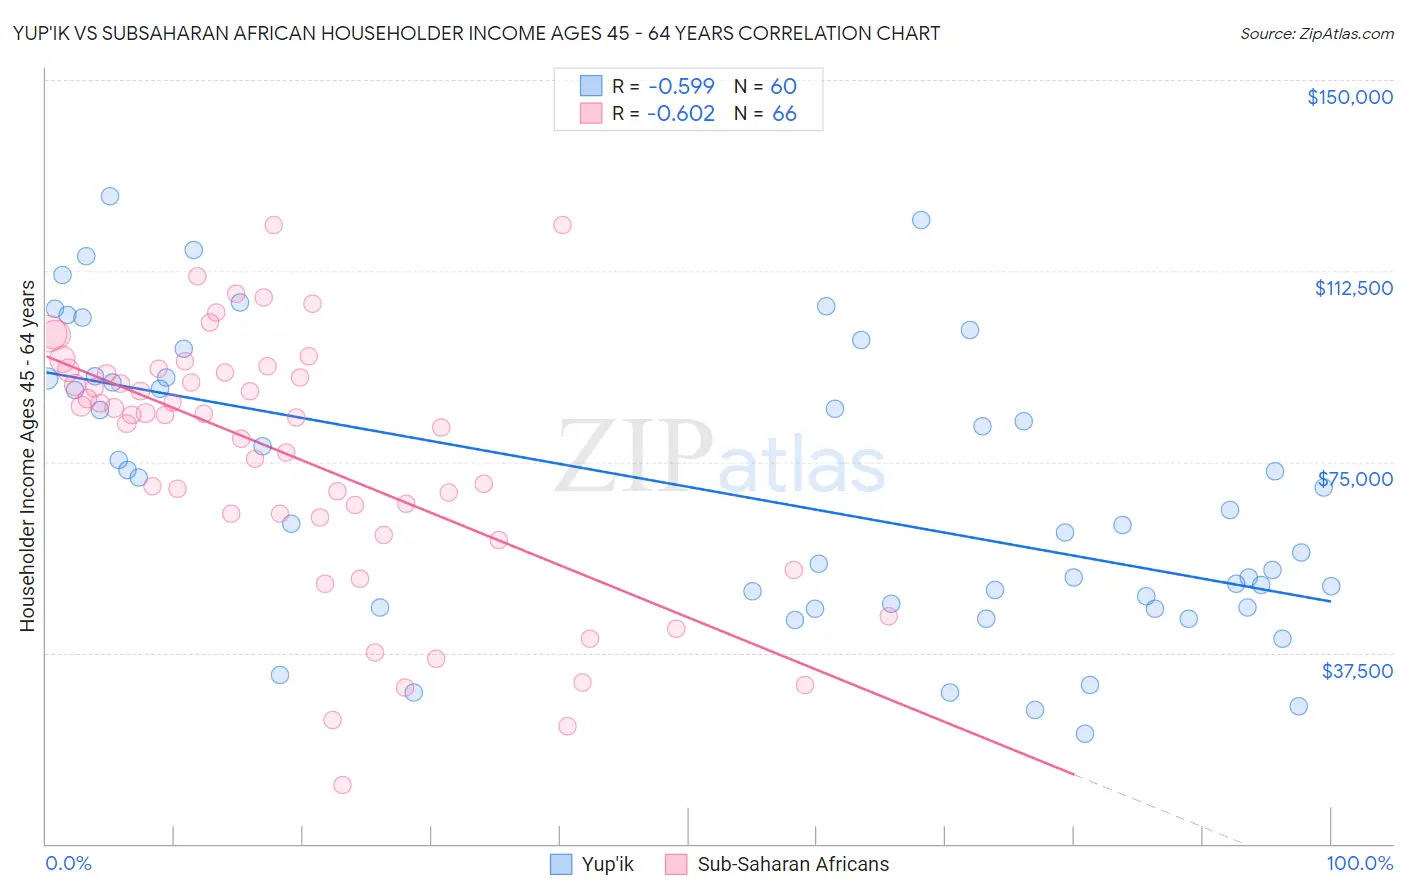
Yup'ik vs Subsaharan African Householder Income Ages 45 - 64 years Correlation Chart
The statistical analysis conducted on geographies consisting of 39,943,055 people shows a substantial negative correlation between the proportion of Yup'ik and household income with householder between the ages 45 and 64 in the United States with a correlation coefficient (R) of -0.599 and weighted average of $81,000. Similarly, the statistical analysis conducted on geographies consisting of 506,198,662 people shows a significant negative correlation between the proportion of Sub-Saharan Africans and household income with householder between the ages 45 and 64 in the United States with a correlation coefficient (R) of -0.602 and weighted average of $90,691, a difference of 12.0%.
Householder Income Ages 45 - 64 years Correlation Summary
| Measurement | Yup'ik | Subsaharan African |
| Minimum | $21,563 | $11,458 |
| Maximum | $127,108 | $121,610 |
| Range | $105,545 | $110,152 |
| Mean | $69,372 | $76,045 |
| Median | $64,271 | $84,198 |
| Interquartile 25% (IQ1) | $46,840 | $64,056 |
| Interquartile 75% (IQ3) | $91,495 | $92,645 |
| Interquartile Range (IQR) | $44,656 | $28,589 |
| Standard Deviation (Sample) | $27,859 | $25,098 |
| Standard Deviation (Population) | $27,626 | $24,907 |
Similar Demographics by Householder Income Ages 45 - 64 years
Demographics Similar to Yup'ik by Householder Income Ages 45 - 64 years
In terms of householder income ages 45 - 64 years, the demographic groups most similar to Yup'ik are Immigrants from Cuba ($80,662, a difference of 0.42%), Bahamian ($81,369, a difference of 0.46%), Dominican ($80,623, a difference of 0.47%), Sioux ($81,750, a difference of 0.93%), and Seminole ($80,077, a difference of 1.1%).
| Demographics | Rating | Rank | Householder Income Ages 45 - 64 years |
| Colville | 0.0 /100 | #317 | Tragic $82,474 |
| Choctaw | 0.0 /100 | #318 | Tragic $82,287 |
| Chickasaw | 0.0 /100 | #319 | Tragic $82,193 |
| Apache | 0.0 /100 | #320 | Tragic $82,184 |
| Yuman | 0.0 /100 | #321 | Tragic $82,139 |
| Sioux | 0.0 /100 | #322 | Tragic $81,750 |
| Bahamians | 0.0 /100 | #323 | Tragic $81,369 |
| Yup'ik | 0.0 /100 | #324 | Tragic $81,000 |
| Immigrants | Cuba | 0.0 /100 | #325 | Tragic $80,662 |
| Dominicans | 0.0 /100 | #326 | Tragic $80,623 |
| Seminole | 0.0 /100 | #327 | Tragic $80,077 |
| Natives/Alaskans | 0.0 /100 | #328 | Tragic $79,816 |
| Dutch West Indians | 0.0 /100 | #329 | Tragic $79,171 |
| Creek | 0.0 /100 | #330 | Tragic $78,960 |
| Immigrants | Dominican Republic | 0.0 /100 | #331 | Tragic $78,836 |
Demographics Similar to Sub-Saharan Africans by Householder Income Ages 45 - 64 years
In terms of householder income ages 45 - 64 years, the demographic groups most similar to Sub-Saharan Africans are Mexican American Indian ($90,811, a difference of 0.13%), American ($90,536, a difference of 0.17%), Immigrants from Laos ($90,909, a difference of 0.24%), Marshallese ($90,455, a difference of 0.26%), and Central American ($90,951, a difference of 0.29%).
| Demographics | Rating | Rank | Householder Income Ages 45 - 64 years |
| Immigrants | Trinidad and Tobago | 1.1 /100 | #243 | Tragic $91,347 |
| Immigrants | Middle Africa | 1.1 /100 | #244 | Tragic $91,293 |
| Guyanese | 0.9 /100 | #245 | Tragic $90,966 |
| Central Americans | 0.9 /100 | #246 | Tragic $90,951 |
| Alaskan Athabascans | 0.9 /100 | #247 | Tragic $90,951 |
| Immigrants | Laos | 0.9 /100 | #248 | Tragic $90,909 |
| Mexican American Indians | 0.8 /100 | #249 | Tragic $90,811 |
| Sub-Saharan Africans | 0.8 /100 | #250 | Tragic $90,691 |
| Americans | 0.7 /100 | #251 | Tragic $90,536 |
| Marshallese | 0.7 /100 | #252 | Tragic $90,455 |
| Barbadians | 0.6 /100 | #253 | Tragic $90,266 |
| Immigrants | Guyana | 0.6 /100 | #254 | Tragic $90,186 |
| West Indians | 0.5 /100 | #255 | Tragic $89,906 |
| French American Indians | 0.5 /100 | #256 | Tragic $89,811 |
| German Russians | 0.4 /100 | #257 | Tragic $89,398 |