Immigrants from Venezuela vs Immigrants from Chile Householder Income Ages 45 - 64 years
COMPARE
Immigrants from Venezuela
Immigrants from Chile
Householder Income Ages 45 - 64 years
Householder Income Ages 45 - 64 years Comparison
Immigrants from Venezuela
Immigrants from Chile
$95,342
HOUSEHOLDER INCOME AGES 45 - 64 YEARS
7.6/ 100
METRIC RATING
216th/ 347
METRIC RANK
$103,412
HOUSEHOLDER INCOME AGES 45 - 64 YEARS
82.5/ 100
METRIC RATING
146th/ 347
METRIC RANK
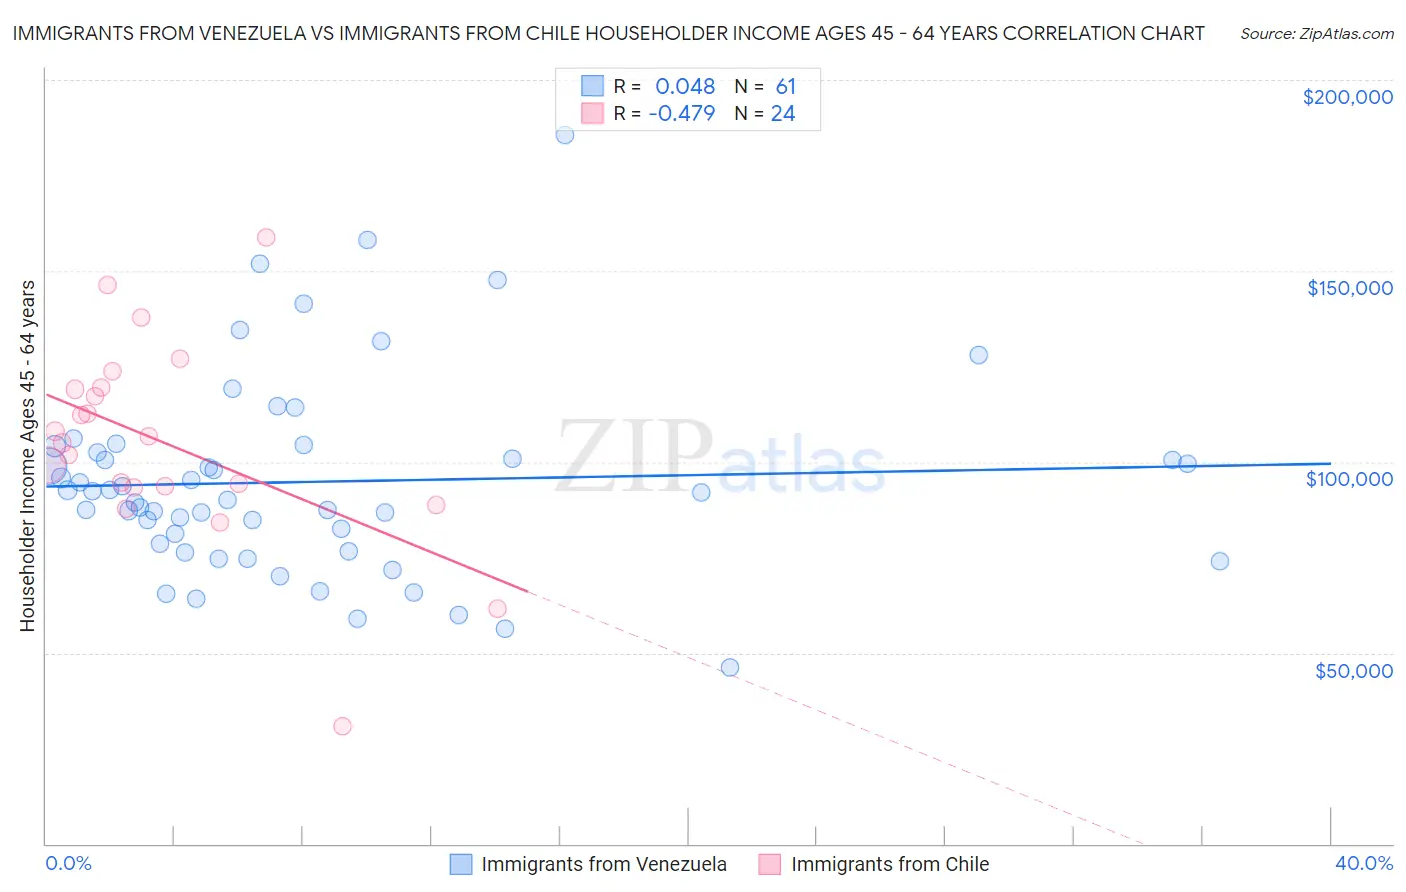
Immigrants from Venezuela vs Immigrants from Chile Householder Income Ages 45 - 64 years Correlation Chart
The statistical analysis conducted on geographies consisting of 287,624,834 people shows no correlation between the proportion of Immigrants from Venezuela and household income with householder between the ages 45 and 64 in the United States with a correlation coefficient (R) of 0.048 and weighted average of $95,342. Similarly, the statistical analysis conducted on geographies consisting of 218,523,915 people shows a moderate negative correlation between the proportion of Immigrants from Chile and household income with householder between the ages 45 and 64 in the United States with a correlation coefficient (R) of -0.479 and weighted average of $103,412, a difference of 8.5%.
Householder Income Ages 45 - 64 years Correlation Summary
| Measurement | Immigrants from Venezuela | Immigrants from Chile |
| Minimum | $46,250 | $30,865 |
| Maximum | $185,667 | $158,750 |
| Range | $139,417 | $127,885 |
| Mean | $94,774 | $105,152 |
| Median | $91,875 | $105,926 |
| Interquartile 25% (IQ1) | $77,515 | $93,461 |
| Interquartile 75% (IQ3) | $103,326 | $119,302 |
| Interquartile Range (IQR) | $25,811 | $25,840 |
| Standard Deviation (Sample) | $26,075 | $26,462 |
| Standard Deviation (Population) | $25,861 | $25,904 |
Similar Demographics by Householder Income Ages 45 - 64 years
Demographics Similar to Immigrants from Venezuela by Householder Income Ages 45 - 64 years
In terms of householder income ages 45 - 64 years, the demographic groups most similar to Immigrants from Venezuela are Nigerian ($95,492, a difference of 0.16%), Immigrants from Ghana ($94,982, a difference of 0.38%), Delaware ($94,914, a difference of 0.45%), Immigrants from Armenia ($94,863, a difference of 0.50%), and Salvadoran ($94,842, a difference of 0.53%).
| Demographics | Rating | Rank | Householder Income Ages 45 - 64 years |
| Japanese | 14.8 /100 | #209 | Poor $96,834 |
| Tsimshian | 14.5 /100 | #210 | Poor $96,783 |
| Immigrants | Cambodia | 13.0 /100 | #211 | Poor $96,537 |
| Venezuelans | 12.6 /100 | #212 | Poor $96,460 |
| Immigrants | Uruguay | 10.7 /100 | #213 | Poor $96,086 |
| Panamanians | 10.6 /100 | #214 | Poor $96,066 |
| Nigerians | 8.2 /100 | #215 | Tragic $95,492 |
| Immigrants | Venezuela | 7.6 /100 | #216 | Tragic $95,342 |
| Immigrants | Ghana | 6.4 /100 | #217 | Tragic $94,982 |
| Delaware | 6.2 /100 | #218 | Tragic $94,914 |
| Immigrants | Armenia | 6.1 /100 | #219 | Tragic $94,863 |
| Salvadorans | 6.0 /100 | #220 | Tragic $94,842 |
| Immigrants | Nigeria | 5.9 /100 | #221 | Tragic $94,804 |
| Malaysians | 5.2 /100 | #222 | Tragic $94,517 |
| Immigrants | Nonimmigrants | 5.0 /100 | #223 | Tragic $94,448 |
Demographics Similar to Immigrants from Chile by Householder Income Ages 45 - 64 years
In terms of householder income ages 45 - 64 years, the demographic groups most similar to Immigrants from Chile are Basque ($103,387, a difference of 0.020%), Ugandan ($103,472, a difference of 0.060%), Czech ($103,507, a difference of 0.090%), Serbian ($103,522, a difference of 0.11%), and Luxembourger ($103,536, a difference of 0.12%).
| Demographics | Rating | Rank | Householder Income Ages 45 - 64 years |
| Immigrants | Oceania | 84.5 /100 | #139 | Excellent $103,705 |
| Norwegians | 84.3 /100 | #140 | Excellent $103,682 |
| Immigrants | Uganda | 83.7 /100 | #141 | Excellent $103,584 |
| Luxembourgers | 83.3 /100 | #142 | Excellent $103,536 |
| Serbians | 83.2 /100 | #143 | Excellent $103,522 |
| Czechs | 83.1 /100 | #144 | Excellent $103,507 |
| Ugandans | 82.9 /100 | #145 | Excellent $103,472 |
| Immigrants | Chile | 82.5 /100 | #146 | Excellent $103,412 |
| Basques | 82.3 /100 | #147 | Excellent $103,387 |
| Immigrants | Germany | 81.5 /100 | #148 | Excellent $103,282 |
| Immigrants | Sierra Leone | 81.1 /100 | #149 | Excellent $103,227 |
| Immigrants | Peru | 80.7 /100 | #150 | Excellent $103,173 |
| Swiss | 79.9 /100 | #151 | Good $103,071 |
| Irish | 79.8 /100 | #152 | Good $103,067 |
| Scandinavians | 79.0 /100 | #153 | Good $102,969 |