Yup'ik vs Immigrants from Chile Median Family Income
COMPARE
Yup'ik
Immigrants from Chile
Median Family Income
Median Family Income Comparison
Yup'ik
Immigrants from Chile
$79,290
MEDIAN FAMILY INCOME
0.0/ 100
METRIC RATING
335th/ 347
METRIC RANK
$105,655
MEDIAN FAMILY INCOME
82.1/ 100
METRIC RATING
147th/ 347
METRIC RANK
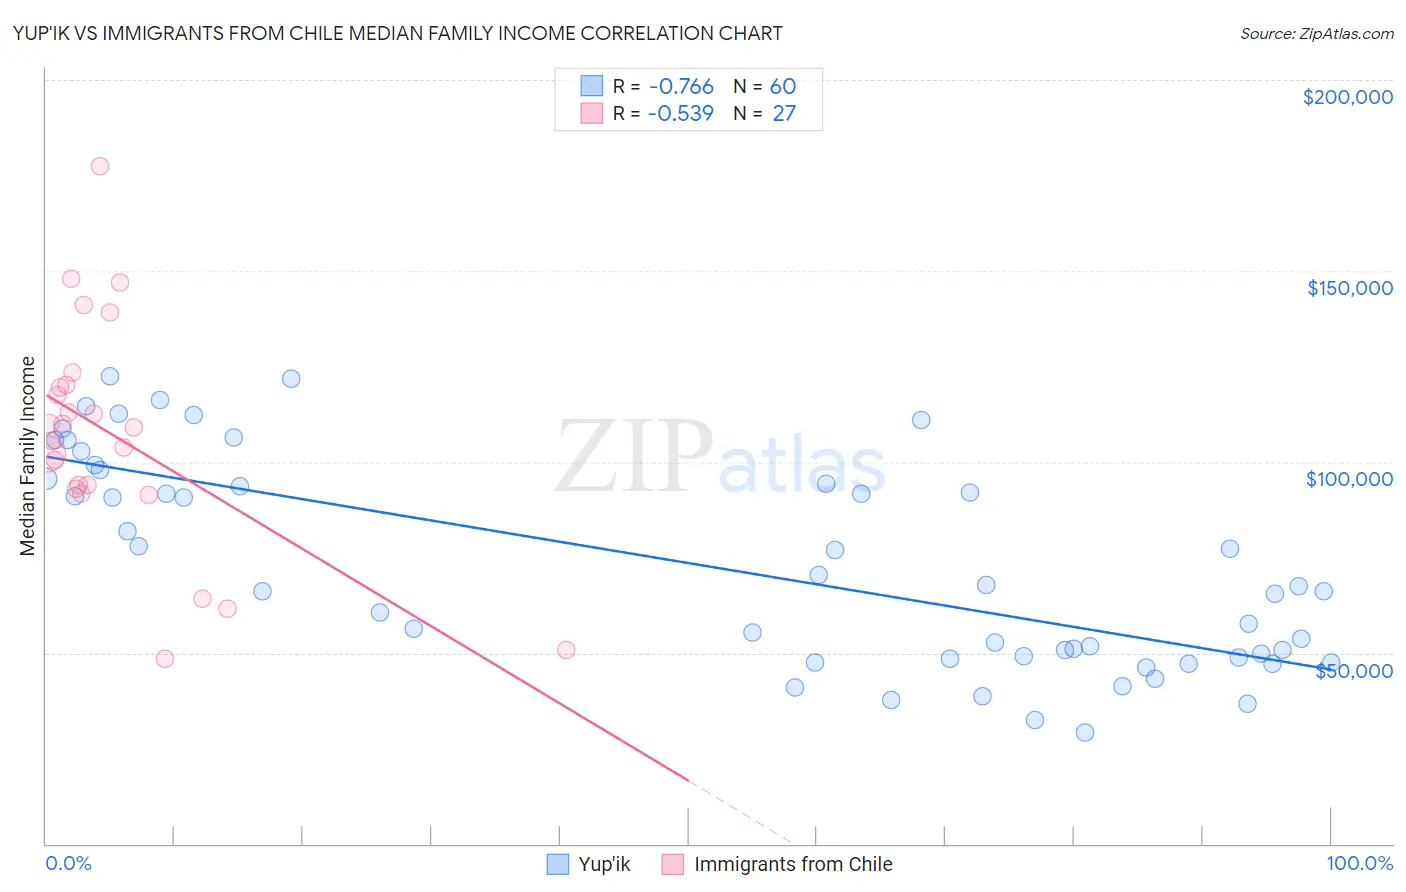
Yup'ik vs Immigrants from Chile Median Family Income Correlation Chart
The statistical analysis conducted on geographies consisting of 39,952,310 people shows a strong negative correlation between the proportion of Yup'ik and median family income in the United States with a correlation coefficient (R) of -0.766 and weighted average of $79,290. Similarly, the statistical analysis conducted on geographies consisting of 218,577,241 people shows a substantial negative correlation between the proportion of Immigrants from Chile and median family income in the United States with a correlation coefficient (R) of -0.539 and weighted average of $105,655, a difference of 33.3%.
Median Family Income Correlation Summary
| Measurement | Yup'ik | Immigrants from Chile |
| Minimum | $29,250 | $48,403 |
| Maximum | $122,399 | $177,440 |
| Range | $93,149 | $129,037 |
| Mean | $72,637 | $106,979 |
| Median | $66,875 | $109,000 |
| Interquartile 25% (IQ1) | $48,824 | $92,919 |
| Interquartile 75% (IQ3) | $95,045 | $120,092 |
| Interquartile Range (IQR) | $46,221 | $27,173 |
| Standard Deviation (Sample) | $27,024 | $29,634 |
| Standard Deviation (Population) | $26,798 | $29,080 |
Similar Demographics by Median Family Income
Demographics Similar to Yup'ik by Median Family Income
In terms of median family income, the demographic groups most similar to Yup'ik are Menominee ($79,563, a difference of 0.34%), Immigrants from Cuba ($78,249, a difference of 1.3%), Yuman ($78,055, a difference of 1.6%), Kiowa ($80,885, a difference of 2.0%), and Native/Alaskan ($80,908, a difference of 2.0%).
| Demographics | Rating | Rank | Median Family Income |
| Blacks/African Americans | 0.0 /100 | #328 | Tragic $81,912 |
| Dutch West Indians | 0.0 /100 | #329 | Tragic $81,852 |
| Cheyenne | 0.0 /100 | #330 | Tragic $81,385 |
| Immigrants | Dominican Republic | 0.0 /100 | #331 | Tragic $81,233 |
| Natives/Alaskans | 0.0 /100 | #332 | Tragic $80,908 |
| Kiowa | 0.0 /100 | #333 | Tragic $80,885 |
| Menominee | 0.0 /100 | #334 | Tragic $79,563 |
| Yup'ik | 0.0 /100 | #335 | Tragic $79,290 |
| Immigrants | Cuba | 0.0 /100 | #336 | Tragic $78,249 |
| Yuman | 0.0 /100 | #337 | Tragic $78,055 |
| Immigrants | Yemen | 0.0 /100 | #338 | Tragic $77,457 |
| Pima | 0.0 /100 | #339 | Tragic $77,431 |
| Hopi | 0.0 /100 | #340 | Tragic $77,188 |
| Pueblo | 0.0 /100 | #341 | Tragic $76,880 |
| Crow | 0.0 /100 | #342 | Tragic $76,605 |
Demographics Similar to Immigrants from Chile by Median Family Income
In terms of median family income, the demographic groups most similar to Immigrants from Chile are Hungarian ($105,609, a difference of 0.040%), Immigrants from Germany ($105,507, a difference of 0.14%), Czech ($105,839, a difference of 0.17%), Irish ($105,453, a difference of 0.19%), and Peruvian ($105,444, a difference of 0.20%).
| Demographics | Rating | Rank | Median Family Income |
| Norwegians | 85.5 /100 | #140 | Excellent $106,144 |
| Immigrants | Syria | 85.3 /100 | #141 | Excellent $106,118 |
| Slovenes | 84.7 /100 | #142 | Excellent $106,020 |
| Tongans | 84.3 /100 | #143 | Excellent $105,967 |
| Immigrants | Morocco | 84.3 /100 | #144 | Excellent $105,964 |
| Danes | 83.8 /100 | #145 | Excellent $105,900 |
| Czechs | 83.4 /100 | #146 | Excellent $105,839 |
| Immigrants | Chile | 82.1 /100 | #147 | Excellent $105,655 |
| Hungarians | 81.7 /100 | #148 | Excellent $105,609 |
| Immigrants | Germany | 80.9 /100 | #149 | Excellent $105,507 |
| Irish | 80.5 /100 | #150 | Excellent $105,453 |
| Peruvians | 80.4 /100 | #151 | Excellent $105,444 |
| Immigrants | Albania | 79.1 /100 | #152 | Good $105,285 |
| Slavs | 77.9 /100 | #153 | Good $105,144 |
| Immigrants | Nepal | 76.3 /100 | #154 | Good $104,966 |