Yup'ik vs Greek Householder Income Ages 45 - 64 years
COMPARE
Yup'ik
Greek
Householder Income Ages 45 - 64 years
Householder Income Ages 45 - 64 years Comparison
Yup'ik
Greeks
$81,000
HOUSEHOLDER INCOME AGES 45 - 64 YEARS
0.0/ 100
METRIC RATING
324th/ 347
METRIC RANK
$112,630
HOUSEHOLDER INCOME AGES 45 - 64 YEARS
99.8/ 100
METRIC RATING
54th/ 347
METRIC RANK
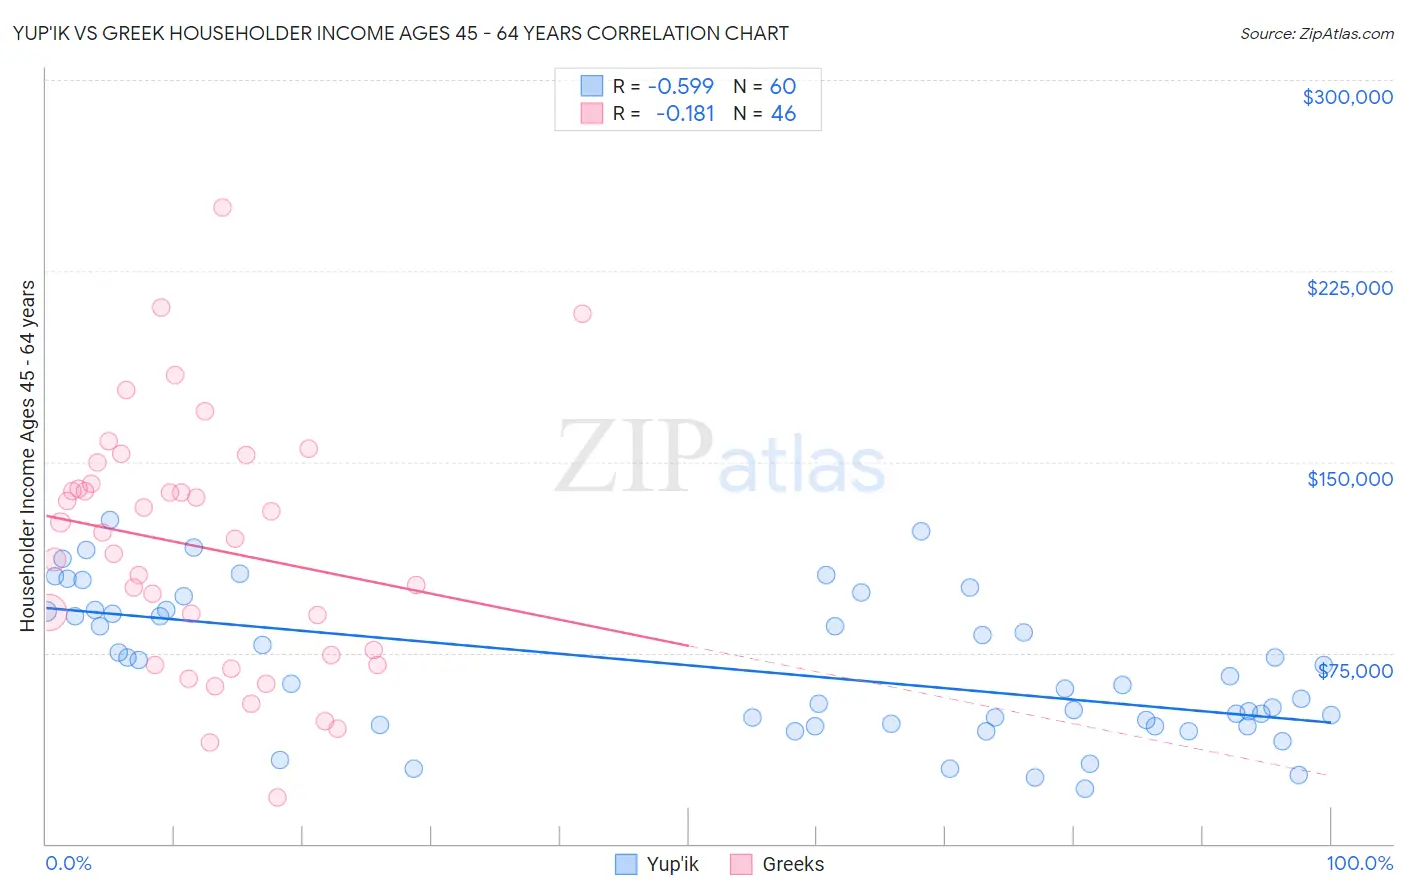
Yup'ik vs Greek Householder Income Ages 45 - 64 years Correlation Chart
The statistical analysis conducted on geographies consisting of 39,943,055 people shows a substantial negative correlation between the proportion of Yup'ik and household income with householder between the ages 45 and 64 in the United States with a correlation coefficient (R) of -0.599 and weighted average of $81,000. Similarly, the statistical analysis conducted on geographies consisting of 481,485,565 people shows a poor negative correlation between the proportion of Greeks and household income with householder between the ages 45 and 64 in the United States with a correlation coefficient (R) of -0.181 and weighted average of $112,630, a difference of 39.1%.
Householder Income Ages 45 - 64 years Correlation Summary
| Measurement | Yup'ik | Greek |
| Minimum | $21,563 | $18,083 |
| Maximum | $127,108 | $250,001 |
| Range | $105,545 | $231,918 |
| Mean | $69,372 | $116,578 |
| Median | $64,271 | $121,059 |
| Interquartile 25% (IQ1) | $46,840 | $74,375 |
| Interquartile 75% (IQ3) | $91,495 | $141,576 |
| Interquartile Range (IQR) | $44,656 | $67,201 |
| Standard Deviation (Sample) | $27,859 | $49,084 |
| Standard Deviation (Population) | $27,626 | $48,548 |
Similar Demographics by Householder Income Ages 45 - 64 years
Demographics Similar to Yup'ik by Householder Income Ages 45 - 64 years
In terms of householder income ages 45 - 64 years, the demographic groups most similar to Yup'ik are Immigrants from Cuba ($80,662, a difference of 0.42%), Bahamian ($81,369, a difference of 0.46%), Dominican ($80,623, a difference of 0.47%), Sioux ($81,750, a difference of 0.93%), and Seminole ($80,077, a difference of 1.1%).
| Demographics | Rating | Rank | Householder Income Ages 45 - 64 years |
| Colville | 0.0 /100 | #317 | Tragic $82,474 |
| Choctaw | 0.0 /100 | #318 | Tragic $82,287 |
| Chickasaw | 0.0 /100 | #319 | Tragic $82,193 |
| Apache | 0.0 /100 | #320 | Tragic $82,184 |
| Yuman | 0.0 /100 | #321 | Tragic $82,139 |
| Sioux | 0.0 /100 | #322 | Tragic $81,750 |
| Bahamians | 0.0 /100 | #323 | Tragic $81,369 |
| Yup'ik | 0.0 /100 | #324 | Tragic $81,000 |
| Immigrants | Cuba | 0.0 /100 | #325 | Tragic $80,662 |
| Dominicans | 0.0 /100 | #326 | Tragic $80,623 |
| Seminole | 0.0 /100 | #327 | Tragic $80,077 |
| Natives/Alaskans | 0.0 /100 | #328 | Tragic $79,816 |
| Dutch West Indians | 0.0 /100 | #329 | Tragic $79,171 |
| Creek | 0.0 /100 | #330 | Tragic $78,960 |
| Immigrants | Dominican Republic | 0.0 /100 | #331 | Tragic $78,836 |
Demographics Similar to Greeks by Householder Income Ages 45 - 64 years
In terms of householder income ages 45 - 64 years, the demographic groups most similar to Greeks are Afghan ($112,676, a difference of 0.040%), Lithuanian ($112,484, a difference of 0.13%), Immigrants from Malaysia ($112,796, a difference of 0.15%), Immigrants from South Africa ($112,886, a difference of 0.23%), and Egyptian ($112,256, a difference of 0.33%).
| Demographics | Rating | Rank | Householder Income Ages 45 - 64 years |
| Australians | 99.9 /100 | #47 | Exceptional $113,533 |
| Immigrants | Indonesia | 99.9 /100 | #48 | Exceptional $113,519 |
| Immigrants | Russia | 99.8 /100 | #49 | Exceptional $113,215 |
| Immigrants | Austria | 99.8 /100 | #50 | Exceptional $113,140 |
| Immigrants | South Africa | 99.8 /100 | #51 | Exceptional $112,886 |
| Immigrants | Malaysia | 99.8 /100 | #52 | Exceptional $112,796 |
| Afghans | 99.8 /100 | #53 | Exceptional $112,676 |
| Greeks | 99.8 /100 | #54 | Exceptional $112,630 |
| Lithuanians | 99.8 /100 | #55 | Exceptional $112,484 |
| Egyptians | 99.7 /100 | #56 | Exceptional $112,256 |
| Immigrants | Scotland | 99.7 /100 | #57 | Exceptional $112,175 |
| Soviet Union | 99.7 /100 | #58 | Exceptional $112,008 |
| Immigrants | Europe | 99.7 /100 | #59 | Exceptional $111,984 |
| Immigrants | Netherlands | 99.7 /100 | #60 | Exceptional $111,982 |
| Immigrants | Czechoslovakia | 99.7 /100 | #61 | Exceptional $111,914 |