Immigrants from Panama vs Immigrants from Chile Householder Income Ages 45 - 64 years
COMPARE
Immigrants from Panama
Immigrants from Chile
Householder Income Ages 45 - 64 years
Householder Income Ages 45 - 64 years Comparison
Immigrants from Panama
Immigrants from Chile
$93,815
HOUSEHOLDER INCOME AGES 45 - 64 YEARS
3.7/ 100
METRIC RATING
228th/ 347
METRIC RANK
$103,412
HOUSEHOLDER INCOME AGES 45 - 64 YEARS
82.5/ 100
METRIC RATING
146th/ 347
METRIC RANK
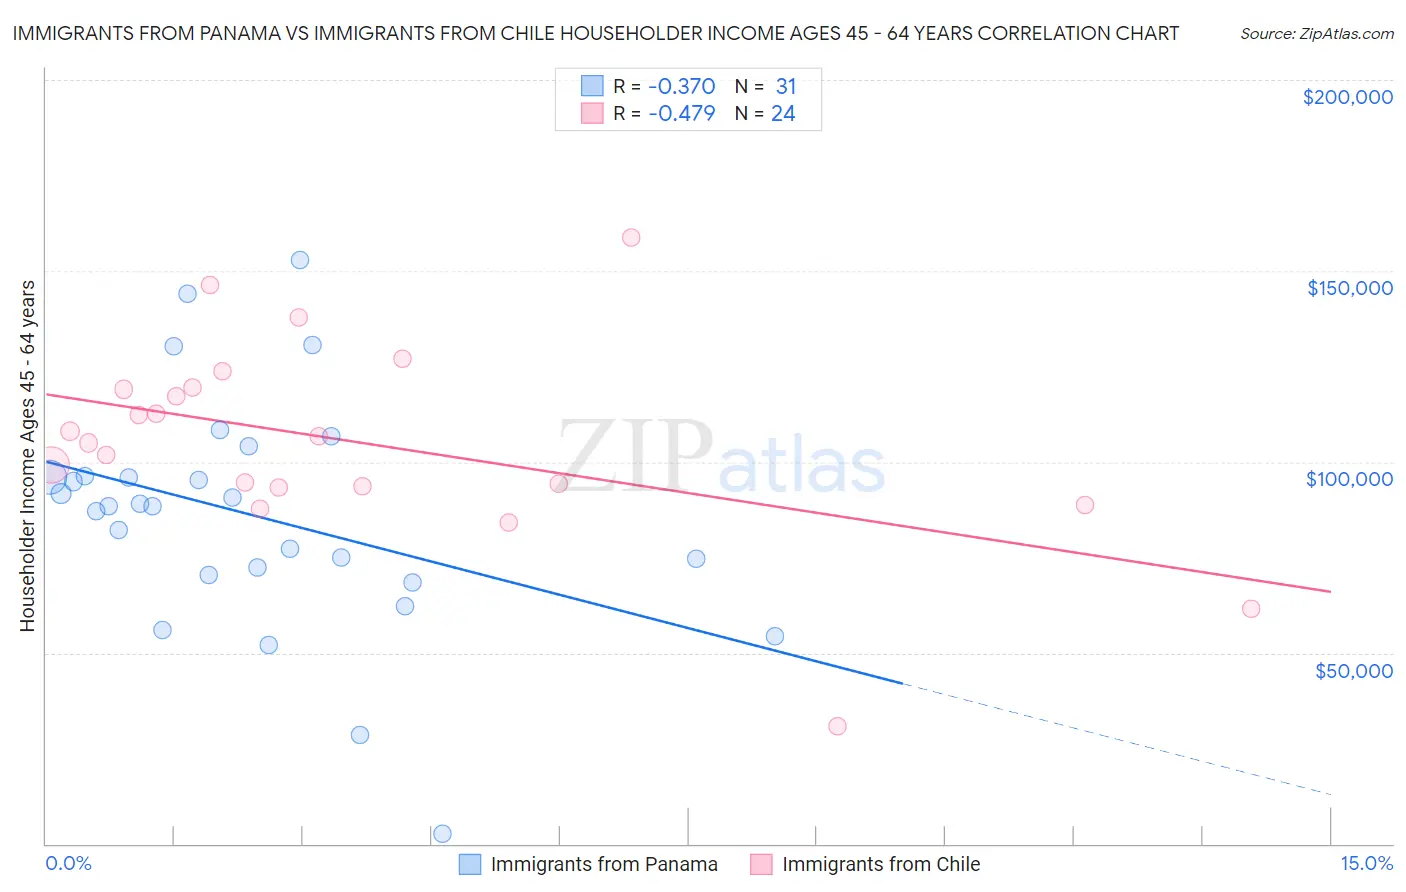
Immigrants from Panama vs Immigrants from Chile Householder Income Ages 45 - 64 years Correlation Chart
The statistical analysis conducted on geographies consisting of 221,006,827 people shows a mild negative correlation between the proportion of Immigrants from Panama and household income with householder between the ages 45 and 64 in the United States with a correlation coefficient (R) of -0.370 and weighted average of $93,815. Similarly, the statistical analysis conducted on geographies consisting of 218,523,915 people shows a moderate negative correlation between the proportion of Immigrants from Chile and household income with householder between the ages 45 and 64 in the United States with a correlation coefficient (R) of -0.479 and weighted average of $103,412, a difference of 10.2%.
Householder Income Ages 45 - 64 years Correlation Summary
| Measurement | Immigrants from Panama | Immigrants from Chile |
| Minimum | $2,499 | $30,865 |
| Maximum | $152,844 | $158,750 |
| Range | $150,345 | $127,885 |
| Mean | $86,009 | $105,152 |
| Median | $88,407 | $105,926 |
| Interquartile 25% (IQ1) | $70,337 | $93,461 |
| Interquartile 75% (IQ3) | $96,322 | $119,302 |
| Interquartile Range (IQR) | $25,984 | $25,840 |
| Standard Deviation (Sample) | $30,853 | $26,462 |
| Standard Deviation (Population) | $30,351 | $25,904 |
Similar Demographics by Householder Income Ages 45 - 64 years
Demographics Similar to Immigrants from Panama by Householder Income Ages 45 - 64 years
In terms of householder income ages 45 - 64 years, the demographic groups most similar to Immigrants from Panama are Vietnamese ($93,788, a difference of 0.030%), Immigrants from Sudan ($93,781, a difference of 0.040%), Ecuadorian ($93,739, a difference of 0.080%), Sudanese ($93,718, a difference of 0.10%), and Alaska Native ($93,991, a difference of 0.19%).
| Demographics | Rating | Rank | Householder Income Ages 45 - 64 years |
| Immigrants | Nigeria | 5.9 /100 | #221 | Tragic $94,804 |
| Malaysians | 5.2 /100 | #222 | Tragic $94,517 |
| Immigrants | Nonimmigrants | 5.0 /100 | #223 | Tragic $94,448 |
| Immigrants | Bosnia and Herzegovina | 4.6 /100 | #224 | Tragic $94,288 |
| Bermudans | 4.4 /100 | #225 | Tragic $94,197 |
| Immigrants | Azores | 4.3 /100 | #226 | Tragic $94,138 |
| Alaska Natives | 4.0 /100 | #227 | Tragic $93,991 |
| Immigrants | Panama | 3.7 /100 | #228 | Tragic $93,815 |
| Vietnamese | 3.6 /100 | #229 | Tragic $93,788 |
| Immigrants | Sudan | 3.6 /100 | #230 | Tragic $93,781 |
| Ecuadorians | 3.6 /100 | #231 | Tragic $93,739 |
| Sudanese | 3.5 /100 | #232 | Tragic $93,718 |
| Nepalese | 3.0 /100 | #233 | Tragic $93,355 |
| Immigrants | El Salvador | 2.7 /100 | #234 | Tragic $93,176 |
| Nicaraguans | 2.0 /100 | #235 | Tragic $92,554 |
Demographics Similar to Immigrants from Chile by Householder Income Ages 45 - 64 years
In terms of householder income ages 45 - 64 years, the demographic groups most similar to Immigrants from Chile are Basque ($103,387, a difference of 0.020%), Ugandan ($103,472, a difference of 0.060%), Czech ($103,507, a difference of 0.090%), Serbian ($103,522, a difference of 0.11%), and Luxembourger ($103,536, a difference of 0.12%).
| Demographics | Rating | Rank | Householder Income Ages 45 - 64 years |
| Immigrants | Oceania | 84.5 /100 | #139 | Excellent $103,705 |
| Norwegians | 84.3 /100 | #140 | Excellent $103,682 |
| Immigrants | Uganda | 83.7 /100 | #141 | Excellent $103,584 |
| Luxembourgers | 83.3 /100 | #142 | Excellent $103,536 |
| Serbians | 83.2 /100 | #143 | Excellent $103,522 |
| Czechs | 83.1 /100 | #144 | Excellent $103,507 |
| Ugandans | 82.9 /100 | #145 | Excellent $103,472 |
| Immigrants | Chile | 82.5 /100 | #146 | Excellent $103,412 |
| Basques | 82.3 /100 | #147 | Excellent $103,387 |
| Immigrants | Germany | 81.5 /100 | #148 | Excellent $103,282 |
| Immigrants | Sierra Leone | 81.1 /100 | #149 | Excellent $103,227 |
| Immigrants | Peru | 80.7 /100 | #150 | Excellent $103,173 |
| Swiss | 79.9 /100 | #151 | Good $103,071 |
| Irish | 79.8 /100 | #152 | Good $103,067 |
| Scandinavians | 79.0 /100 | #153 | Good $102,969 |